Articles

Article Tools
 View Full Text View Full Text |
 Abstract Abstract |
 Article as PDF Article as PDF |
 Print this Article Print this Article |
 Pubmed Pubmed |
 PMC PMC |
 PubReader PubReader |
 Export to Citation Export to Citation |
 Email Alerts Email Alerts |
 Open Access Open Access |
Share this article on :


Stats or Metrics
Article
Technologue
Exp Neurobiol 2022; 31(3): 208-220
Published online June 30, 2022
https://doi.org/10.5607/en22011
© The Korean Society for Brain and Neural Sciences
Simultaneous Cellular Imaging, Electrical Recording and Stimulation of Hippocampal Activity in Freely Behaving Mice
Chae Young Kim1,2, Sang Jeong Kim1* and Fabian Kloosterman2,3,4,5*
1Department of Physiology, Seoul National University College of Medicine, Seoul 03080, Korea, 2NERF, Leuven 3000, 3Brain & Cognition, KU Leuven, Leuven 3000, 4VIB, Leuven 3001, 5imec, Leuven 3001, Belgium
Correspondence to: *To whom correspondence should be addressed.
Fabian Kloosterman, TEL: 32-16-28-35-14
e-mail: fabian.kloosterman@nerf.be
Sang Jeong Kim, TEL: 82-2-740-8229, FAX: 82-2-763-9667
e-mail: sangjkim@snu.ac.kr
This is an Open Access article distributed under the terms of the Creative Commons Attribution Non-Commercial License (http://creativecommons.org/licenses/by-nc/4.0) which permits unrestricted non-commercial use, distribution, and reproduction in any medium, provided the original work is properly cited.
Abstract
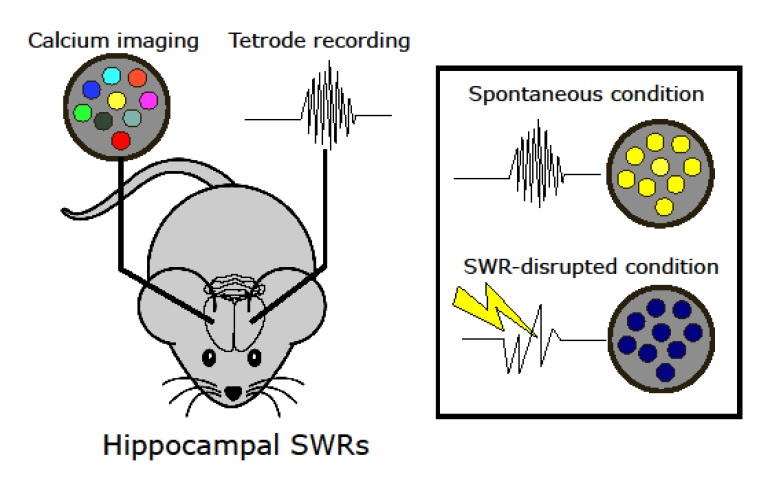
Hippocampal sharp-wave ripple activity (SWRs) and the associated replay of neural activity patterns are well-known for their role in memory consolidation. This activity has been studied using electrophysiological approaches, as high temporal resolution is required to recognize SWRs in the neuronal signals. However, it has been difficult to analyze the individual contribution of neurons to task-specific SWRs, because it is hard to track neurons across a long time with electrophysiological recording. In this study, we recorded local field potential (LFP) signals in the hippocampal CA1 of freely behaving mice and simultaneously imaged calcium signals in contralateral CA1 to leverage the advantages of both electrophysiological and imaging approaches. We manufactured a custom-designed microdrive array and targeted tetrodes to the left hippocampus CA1 for LFP recording and applied electrical stimulation in the ventral hippocampal commissure (VHC) for closed-loop disruption of SWRs. Neuronal population imaging in the right hippocampal CA1 was performed using a miniature fluorescent microscope (Miniscope) and a genetically encoded calcium indicator. As SWRs show highly synchronized bilateral occurrence, calcium signals of SWR-participating neurons could be identified and tracked in spontaneous or SWR-disrupted conditions. Using this approach, we identified a subpopulation of CA1 neurons showing synchronous calcium elevation to SWRs. Our results showed that SWR-related calcium transients are more disrupted by electrical stimulation than non-SWRrelated calcium transients, validating the capability of the system to detect and disrupt SWRs. Our dual recording method can be used to uncover the dynamic participation of individual neurons in SWRs and replay over extended time windows.
Graphical Abstract
Keywords: Hippocampus, Brain wave, Calcium, Electrophysiology
INTRODUCTION
In the field of systems neuroscience, uncovering communication between brain regions is one way of explaining their contribution to animal behavior, including learning and memory processes [1]. One widely used approach to tackle this question is the recording of neuronal activity from freely behaving animals using tetrodes or neural probes [2-4]. Both measurements of single cell spiking activity and the local field potential (LFP) provide information about network computations. The high temporal resolution of these electrical signals enables the detailed study of neuronal synchronization and network dynamics that underly cognitive processes. While electrophysiological approaches are capable of recording from large populations of neurons, they suffer from difficulties to track cell identity long-term and offer limited information about the spatial organization and genetic identity of the cells.
Over the past years, single-photon Ca2+ imaging with miniature implantable microscopes has been established as an alternative method to measure cellular activity in freely behaving animals [5-8]. In vivo chronic imaging not only keeps track of individual neurons across days but can also give detailed information about the spatial distribution of cells and whether they belong to genetically identified neuronal subpopulations. Some studies have used single-photon Ca2+ imaging in freely behaving animals successfully to elucidate the neuronal mechanisms underpinning specific behaviors [5, 6]. However, because of the relatively slow dynamics of calcium transients, it is difficult to relate calcium signals to the specific timing of behavior and fast network dynamics. To better appreciate neuronal activity in freely moving animals in both temporal and spatial aspects, it is necessary to complement Ca2+ imaging with electrophysiological recordings.
Sharp-wave ripples (SWRs) are a characteristic neural activity pattern found in the hippocampus [4, 9], showing highly synchronized bilateral occurrence in both adult and neonatal rodents [10-15]. Their contribution of SWRs to memory, including memory consolidation [16-20], is widely studied in behavioral experiments using both correlation approaches and temporally-specific manipulations [21-25]. The high-frequency (140~225 Hz) SWR pattern in the hippocampus encodes behaviorally relevant cellular spike ensembles [26], suggesting its role in memory consolidation by re-activating previously activated neurons (replay) [27-30]. However, hippocampal replay has been studied mainly using electrophysiological approaches and it has been difficult to identify and track individual neurons that participate in a replay over time and across conditions. In addition, it has not been clarified how hippocampal neurons are affected by electrical stimulation used to disrupt SWRs in experiments that aim to test their role in behavior.
In this study, we combined electrophysiological recording and Ca2+ imaging simultaneously to investigate how cellular activity in the hippocampus changes during spontaneous and disrupted SWRs in freely behaving mice. We built a custom-designed microdrive and demonstrated simultaneous observation of SWRs from mice expressing the genetically encoded calcium sensor GCaMP6s. We analyzed the cellular activity of hippocampal CA1 during spontaneous and disrupted SWR conditions acquired by both techniques. We observed significantly increased Ca2+ activity from hippocampal neurons surrounding spontaneous SWRs, but a silent signal in the SWR disrupted condition.
MATERIALS AND METHODS
Animals
All mouse experiments were performed with the approval of the KU Leuven animal ethics committee. Animals were housed under standard conditions (12 h light: 12 h dark cycle) with food and water provided ad libitum. Data for this study were derived from a total of 5 Thy1-GCaMP6s-GP4.3 mice (3 males and 2 females, 10~16 weeks old) that were bred in-house. Robust expression of GCaMP6s in the hippocampus was confirmed in brain sections [31].
Design of implant
The implant consists of two components: a miniscope V3 (Labmaker, Germany) and a custom tetrode microdrive array. Taking advantage of the bilateral synchronous occurrence of SWRs [4, 9, 15], the microdrive array was devised to carry out electrophysiological tetrode recording from freely moving animals in the left hemisphere while the right hemisphere was imaged by the miniscope.
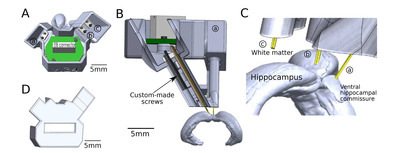
The microdrive array component was designed considering the anatomical position of three targets in the left hemisphere: dorsal CA1 (dCA1, for recording), the ventral hippocampal commissure (VHC, for stimulation), and white matter above the hippocampus (WM, for reference), using Allen Mouse Brain Explorer (http://mouse.brain-map.org/static/brainexplorer) as an anatomical reference. SolidWorks (Dassault Systèmes, France) was used for the 3D CAD design, and the microdrive array was printed using stereolithography (Formlabs, USA. Resin: photopolymer resin black (RS-F2-GPBK-04), gray (RS-F2-GPGR-04), or dental SG resin (RS-F2-DGOR-01). Printer model: Form 3).
The size and shape of the microdrive array were carefully designed to ensure enough surface for the implanted GRIN lens and the footprint of the miniscope. The main body (Fig. 1A, 1B) consists of three cannulas targeting the three brain regions (Fig. 1C). Each cannula guides a bundle of electrodes that is independently moveable through custom screws to control the insertion depth in the brain (Fig. 1B, arrow). The protective cover (Fig. 1D) still partially exposed the connector of the electrode interface board (EIB) and screw heads for convenient recording and tetrode adjustment during experiments without removing the cover (Fig. 2M).
Microdrive array fabrication
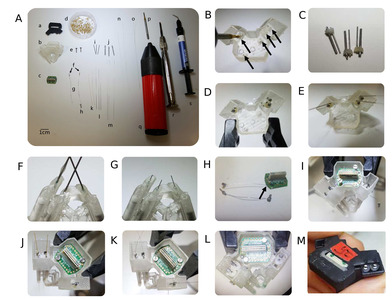
Multiple materials were required for building the tetrode microdrive (Fig. 2A), as follows:
a: 3D-printed protective cover, b: 3D-printed microdrive array body, c: electronic interface board (Neuralynx, USA), d: gold pins (Neuralynx), e: 2x M1.2 screws, f: a pair of female-male breakaway header pins (Farnell, UK), g: 2x ground wires (PFA-coated stainless steel wire, bare diameter: 127 μm, coated diameter: 203.2 μm, length: ~3 cm; A-M system, USA), h: 1x self-tapping bone screw (shaft diameter: 1.19 mm, length: 4.8 mm; Fine Science Tools, Germany), i: 3x 23 G tubing (Microgroup, USA), j: 3x custom-made microdrive screws [32], k: 2x polyimide tubings (ID: 0.102 mm, OD: 0.1397 mm, length: ~50 mm; Nordson, USA), l: 3x 30 G tubings (length: ~55 mm; Microgroup, USA), m: 3x 6mil pre-cut stainless-steel wires (length: ~80 mm; Microgroup, USA) , n: 2x tetrode wires (four twisted 0.012 mm polyimide-insulated nickel-chrome wires, blunt cut; Sandvik, Sweden), o: 1x stimulus electrode (two twisted 0.06 mm polyimide-insulated stainless steel wires, blunt cut; California Fine Wire, USA), p: thread-forming taps for M1.2 screws, q: tap handle, r: screwdriver, s: UV-curable dental cement (Dental elite, France). Detailed provider, model number, and costs of each material are provided in Table 1.
The detailed manufacturing steps are as follows (adapted from the previous protocol [32, 33]).
1) Tap and form thread for the five screw holes (arrows) in the microdrive body (Fig. 2A, b) using the thread forming tap (Fig. 2A, p). Use a tap handler (Fig. 2A, q) if necessary (Fig. 2B).
2) Prepare three screw-driven shuttles by connecting 23 G tubing (Fig. 2A, i) and a microdrive screw (Fig. 2A, j) using UV-curable dental cement (Fig. 2A, s) using a mold (Fig. 2C).
3) Insert the shuttles into the microdrive body (Fig. 2D).
4) Insert the 30 G tubing (Fig. 2A, l) into the 23 g tubing of custom screws (Fig. 2E).
5) Cement the 30 G tubings onto the outlet of cannulas in the microdrive array body using dental cement. On the outlet side, fill gaps between tubings and cannulas. On the opening side of the cannulas, make sure 30 G tubing is positioned 2~3 mm lower than 23 G tubing (Fig. 2F).
6) Cut off excess 30 G tubings from the outlet, and file the ends. Make sure 30 G tubings have completely open ends by penetrating inserted 6mil wires (Fig. 2A, m). Remove wires after confirming a clear opening (Fig. 2G).
7) Prepare ground wires: solder one end of ground wire (Fig. 2A, g) to the female header pin (Fig. 2A, f, right) and connect the other end to EIB (Fig. 2A, c, arrow in Fig. 2H) using a gold pin (Fig. 2A, d). Solder one end of the other ground wire to the male header pin (Fig. 2A, f left) and the other end to the stainless-steel screw (Fig. 2A, h). Cut the screw to 3~4 mm and file the end (Fig. 2H).
8) Attach the EIB to the microdrive array body with screws (Fig. 2A, e). The ground wire goes through the hole in the bottom of the microdrive array (Fig. 2I).
9) Retract the custom screws to the level of the microdrive opening. The working distance of the screws is 7~8 mm. Insert polyimide tubing (Fig. 2A, k) into 30 G tubing. Cut excess polyimide tubing to the same length as 30 G tubings (Fig. 2J). The polyamide tubing serves to guide and protect the tetrodes.
10) Prepare two tetrodes by twisting and heat-fusing four insulated electrode wires (Fig. 2A, n).
11) Insert tetrodes into the polyimide tubing. Insert a stimulus wire (Fig. 2A, o) into the third microdrive without polyimide tubing. Fix the stimulation electrode and tetrodes in the polyimide tubing using glue. (Fig. 2K).
12) After the glue has dried, secure tetrodes and the stimulus wire in the EIB using gold pins (Fig. 2L). Make sure tetrodes and stimulation wire have enough working distance of 7~8 mm. Cut off excess wires.
13) Close the microdrive array with the 3D-printed cover (Fig. 2A, a). Fix the cover to the body using dental cement (Fig. 2M).
14) To lower tetrode impedance, goldplate tetrode tips [33] 1~4 hours before the implantation.
The total weight of the microdrive array is 2.2 g, the height is 1.3 mm, the largest width is 1.5 mm, and the working distance of each custom-made screw in the cannula is approximately 7 mm. A cross-section of the microdrive array is shown in Fig. 1B. The total weight that animals carry during experiments is 5.2 g (microdrive array 2.2 g+miniscope 3 g, Fig. 3E).
Surgical procedure
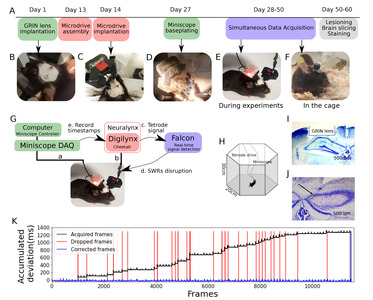
For the simultaneous acquisition of calcium signal and LFP, animals underwent several surgical procedures including GRIN lens implantation, microdrive array implantation, and baseplating of the miniscope (Fig. 3A).
Gradient-index (GRIN) lens implantation
After induction of anesthesia (1.5% isoflurane in an induction chamber), the skull of the animal was securely fixed to the stereotaxic frame. Throughout the surgical process, the isoflurane level was maintained at 1~1.5% through a nose cap. The body temperature of the animal was monitored and kept at a constant temperature using a rectal probe and an electrical heating pad. After disinfection of the scalp with iodine and isopropyl alcohol, the skull was exposed. Craniotomy for the GRIN lens was made on the right hemisphere, a circle with the size of 0.95 mm semi-diameter from the center (center coordinates: 4 mm posterior to bregma, 2.2 mm right from the midline). After exposing the brain in a circular shape, the dura, cortex, and white matter were gradually aspired until the hippocampus was exposed. GRIN lens (diameter: 1.8 mm, length 4.31 mm, Edmund Optics, UK) was inserted into the cavity of the brain at the speed of 50 μm/10 s. When the lens reached the target region, the gap between the lens and skull was filled with Kwik-sil (WPI, USA) and then cemented to the skull by metabond (Parkell, USA) (Fig. 3B). The exposed GRIN lens was protected by a mass of Kwik-sil. Animals underwent 2 weeks recovery period after the implantation. CA1 under the implanted GRIN lens was imaged by miniscope to confirm the blood clearance and find image planes. If 20~30 cells were observed from the raw data, animals proceeded to the microdrive implantation.
Microdrive mounting
3 craniotomies were made to the skull to target 3 different brain regions (VHC: 0.0 mm posterior to bregma, 0.2 mm right from the midline, Hippocampus: 1.1 mm posterior to bregma, 1.5 mm left from the midline, White matter and cortex: 4.1 mm posterior to bregma, 1.5 mm left from the midline). After the removal of dura from 3 craniotomies, the microdrive was mounted and cemented (Fig. 3C). A stainless screw with grounding wire was installed over the cerebellum and served as ground. Another end of the wire was carefully inserted into the sockets attached to the microdrive using breakaway header pins.
Miniscope baseplating
After 5~7 days of the postoperative period after microdrive implantation, we sought for imaging areas where the most calcium activities were found. Once the optimal imaging plane for long-term recording was chosen, a baseplate was mounted and cemented to the brain (Fig. 3D). After the baseplate was settled, miniscope sat on the baseplate and was adjusted to find the focal plane for imaging.
After all surgical processes were done, animals carried tetrode microdrive and baseplate in the cage (Fig. 3E), and miniscope was additionally mounted for experiments (Fig. 3F).
Electrophysiological recording
For the hippocampal SWRs recording and disruption, tetrode and stimulation wires were gradually lowered to the target brain regions. Electrophysiology was performed with the Digital Lynx 16SX (Neuralynx) data acquisition system with HS-18-LED analog headstage (Neuralynx) and Cheetah software (Neuralynx). Wide-band (0.1 Hz~6 kHz) signals were sampled and digitized at 32 kHz. From the recorded tetrode signal, SWRs waveform was detected using a band-pass filter between 140 Hz~225 Hz. Multi-unit activity (MUA) was acquired by a band-pass filter between 600~6000 Hz. The position of the animal was tracked and captured at 50 Hz using an overhead video camera using blue and red LEDs attached to the headstage. The location of tetrodes was confirmed by the presence of SWRs in the LFP.
In-vivo single-photon calcium imaging
After the microdrive array EIB was connected to the recording tether, the minicope was attached to the baseplate and firmly secured. Data acquisition was performed while animals performed unrewarded exploration in the hexagonal arena (Fig. 4A) or a linear track (Fig. 4B). Image frames were acquired at 30 Hz and timestamped in the DigiLynx acquisition system (Neuralynx) for synchronization with the electrophysiological signal (Fig. 3G, a). Time deviation between acquired image frames and theoretically generated frames was corrected by detecting missing frames and inserting matching delays (Fig. 3K).
Online ripple detection and disruption
Online detection and disruption of hippocampal SWRs were performed as described previously [25]. Briefly, digitized signals from the DigiLynx acquisition system were streamed to a workstation running the real-time processing software Falcon (Fig. 3G, b) [34]. The signal was bandpass filtered in the ripple frequency band (135~225 Hz) using a Chebyshev type-II IIR filter (order=20). A ripple event was detected once the ripple power crossed a threshold that is computed from running estimates of the mean (µ) and mean absolute deviation (MAD) as µ+f x MAD. Here, f is a multiplication factor that was set manually to a value in the range between 9~14. For disruption, each ripple detection triggered a stimulator (A385 stimulus isolator, World Precision Instrument, USA) to produce a constant-current biphasic stimulation pulse (0.2 ms duration) in the ventral hippocampal commissure (Fig. 3G, c). The amplitude of the stimulation current was chosen such as to consistently disrupt hippocampal ripple events (range: 130 μA and 200 μA). The output stimulation frequency was limited to a maximum of 2 Hz to avoid overstimulation. To avoid spurious detections induced by movement artifacts or stimulus-evoked responses, the above detection process was also applied to signals from the cortex overlying the hippocampus. Detections of hippocampal ripples that fall within a 1.5 ms- to 40 ms time window around spurious detections in the cortical signal were rejected.
1-photon calcium imaging analysis
The acquired miniscope images were preprocessed semi-automatically with the Python package Minian (https://github.com/DeniseCaiLab/minian). Briefly, the software subtracted the low-frequency background signal from the raw video and corrected for movement. The global baseline calcium signal was calculated, and ΔF/F was computed for each video frame.
On the extracted ΔF/F, spatial and temporal separation processes were executed using the CNMF (Constrained Nonnegative Matrix Factorization) algorithm [35]. In each step of the process, intermediate results of 10 randomly chosen cells were provided to guide manual intervention of the parameters for spatial and temporal distance for cell extraction. The final processed results included the spatial location of cells and calcium traces.
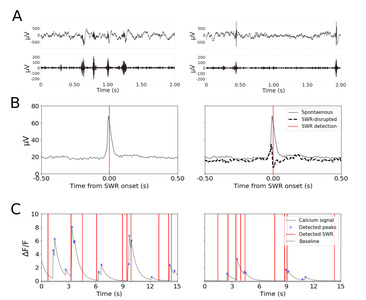
For each detected cell, an average of the lowest 30% of total signals in the spontaneous condition were used as a baseline in both conditions. Local maxima of the calcium signals higher than the baseline were detected and admitted as peaks. Considering the slow decay curve of the GCaMP6s [36], calcium peaks detected within 2 s of online SWRs were classified as SWR-preceding peaks and the rest peaks were labeled as non SWR-preceding peaks.
Statistics
To compare the activity of cells during hippocampal SWRs to the activity without SWRs, we computed the average amplitude of peaks in each category of all units. The two-proportion z-test was used to compare the difference in proportions of unit properties in each category.
To compare the average peak amplitude ratio by peak properties, we defined the ratio as a difference in peak amplitude of the two groups divided by the sum of the average peak amplitude of the two groups.
sp: average peak amplitude in spontaneous condition
st: average peak amplitude in SWR-disrupted condition
A binomial test was used to examine the likelihood of the cell proportion above the chance level. Wilcoxon signed rank test was used to assess the effect of electrical disruption on SWR-related calcium activity for all units. 99% bootstrap confidence intervals were acquired by repeatedly computing medians from randomly detected samples 1000 times.
Histology
After the experiments animals were deeply anesthetized (1.5% of isoflurane through a nose cap) and electrolytic lesions (constant current pulses, 60 μA, 20 seconds) were made to mark the location of the recording and stimulation electrodes. Animals were perfused with a phosphate-buffered saline solution followed by a 4% paraformaldehyde solution for fixation. The brain was stored in 30% sucrose solution, coronally sliced using a cryotome (Leica CM3050S, thickness: 50 μm), and mounted on microscope slides. Brain sections were stained for Nissl substance and were covered using DPX (Sigma Aldrich) mounting medium. Brain sections were inspected under an optical microscope (Olympus MVX10) to examine the lesion marks and the GRIN lens insertion depth.
RESULTS
Implant for combined cellular imaging, electrical recording, and stimulation
For the simultaneous acquisition of calcium and electrophysiological signals in hippocampal CA1 from freely behaving mice, we combined a miniscope for 1-P calcium imaging and a custom-made microdrive array for LFP recording. The microdrive array was designed using 3D-CAD software, 3D-printed, and was equipped with tetrodes and stimulation electrodes.
The miniscope endoscopic lens was implanted on top of the right hippocampal field CA1 (Fig. 3I). One tetrode was positioned near the CA1 cell layer in the left hemisphere to measure SWRs (Fig. 3J). The hippocampal calcium and electrophysiological signals from 4 freely behaving mice were acquired in two different recording conditions.
Simultaneous electrophysiological recording and 1-photon imaging from freely moving mice
4 animals explored a familiar arena (Fig. 3H, hexagonal arena, 20 cm long sides) in a spontaneous condition.
Hippocampal LFP was characterized by theta oscillations as the animal was moving and SWRs as the animals paused. Fast and transient neural activity patterns such as SWRs can be easily identified in the LFP (Fig. 4A).
Cellular calcium signals were acquired alongside the behavior and LFP (Fig. 4C left and right). We took advantage of the simultaneous imaging of cell activity and LFP recording to relate calcium signals to SWR events.
Hippocampal calcium imaging during SWR disruption by electrical stimulation
Using our dual recording system, we demonstrate the combination of electrical recording and disruption of SWRs together with the imaging of CA1 cell activity in freely behaving mice. Hippocampal LFP and calcium signals were collected while animals (n=4, 1 session per animal) stayed in the hexagonal arena for 10 minutes (Table 2). Throughout the experiments, SWRs were detected online using a custom real-time processing system [34]. For half the recording time (5 mins), SWRs were left unperturbed (Fig. 4A, left) and for the other half of the time (5 mins), SWRs were disrupted by a brief stimulation pulse in VHC (Fig. 4A, right). The order of spontaneous/SWR-disrupted condition blocks was randomized across recording sessions. We did not observe artifacts in the calcium images caused by electrical stimulation.
As shown previously [25], VHC stimulation evokes a short positive potential and reduces the ripple power in CA1 (Fig. 4B right), compared to the strong ripple power in the unperturbed signals (Fig. 4B left). Independently detected online SWRs were aligned to the analyzed calcium signals (Fig. 4C).
Effect of SWR-disruption on the calcium peak amplitude
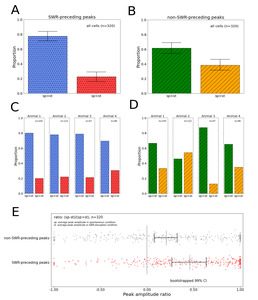
We looked at the cell activity in the right CA1 as measured by calcium imaging (n=105, 122, 47, 46 cells in 4 animals). From all cells, all calcium peaks were classified into SWR-preceding peaks and non-SWR-preceding peaks depending on the presence of a preceding online-detected SWR within 2 s. When comparing average amplitudes of peaks with preceding SWRs of all cells in the two conditions, most cells showed decreased amplitude in the SWR-disrupted condition than in the spontaneous condition (Fig. 5A). This result implies an effective detection and disruption of SWRs, and our dual recording system confirms decreased calcium activity by the SWR disruption, especially when the peaks immediately follow SWRs. The effect of disruption was present in all animals (Fig. 5C). On the other hand, the proportion of unit properties based on the average peak amplitudes without preceding SWR signals in the two conditions showed that less proportion of units showed decreased peak amplitudes when the disruptive stimulation was applied (p-value<0.0001, Two proportion z-test, Fig. 5B). Also, the variation of proportion between animals was relatively larger (Fig. 5D).
Next, we compared the distribution of the average peak amplitudes of each peak group in the SWR-disrupted condition in relation to the spontaneous condition. The distribution showed that there is a significant difference between the two groups depending on the presence of preceding SWR (p-value<0.0001, Wilcoxon signed-rank test, Fig. 5E).
DISCUSSION
In this paper, we have presented a novel approach to combine tetrode recording, closed-loop stimulation and 1-photon imaging in freely moving mice. Electrophysiological recordings and cellular imaging complement each other to single out cells from aggregated signals, monitor target cells in the long term and have access to fast dynamics of neural activity.
Previous studies have combined single-photon microendoscope with deep brain stimulation [37] or silicon probe recordings [38]. To our knowledge, our study is the first to use a custom-designed implant for simultaneous electrophysiological recording, closed-loop electrical stimulation and single-photon microendoscope .
One of the critical requirements for the implant design is to secure enough space on the skull to implant the base plate of the miniscope. To reduce the volume of the microdrive array, we kept only the minimal components possible that make the drive functional. The thickness of the 3D-printed structures was minimized to reduce volume and weight while keeping robust stability for long-term recording. A shorter working distance of the microdrives would have reduced weight further, but we kept it at 7 mm for future application in deeper brain areas. The microdrive array needs less than 8 hours manufacturing time, and we confirmed stable and fully functioning recording and stimulation for more than 5 months after implantation in some animals. This shows that our tool is suitable for long-term electrophysiological recording and imaging from freely moving small animals with a short preparation time.
Hippocampal SWRs are well known for their role in memory encoding and consolidation during awake or resting states [23-25]. Electrical stimulation applied to the VHC fibers is instantly transmitted to the hippocampus bilaterally, resulting in immediate interference of cellular activity [39]. Disruption of SWRs by VHC stimulation has been used to study their contribution to learning [19, 25, 39]. SWRs are ubiquitous and mostly occur synchronously in both hemispheres from the early stage of life [9-11, 15]. We took advantage of this feature to enable measurements of the same SWRs by electrical recordings and CA2+ imaging in the left and right hippocampi respectively. According to our data, even though SWRs were detected in the left hippocampus, an increase in cellular calcium activity was also found in the right hippocampus. Likewise, disruption of SWRs by stimulation of the VHC also exhibited bilateral silencing of calcium activity in the hippocampus. Calcium activity that we observed is from a limited area of dorsal CA1, but as SWRs occur across an extensive region of the hippocampus, we assume that a substantial number of cells in the entire dorsal hippocampus are involved in this synchronized activity. It is generally hypothesized that hippocampal SWRs engage a wide cortical network that is required for rapid encoding of new information and the formation of long-term memory [16-18, 22, 40].
There are some limitations to our approach. First, even though there is broad literature about the synchronous occurrence of SWR in both hippocampi, there is also indication that SWRs in both hemispheres may have different timing [41]. Such (partial) inter-hemispheric decorrelation would have resulted in an underestimate of the calcium response to SWRs in our data. Second, for online SWR detection there is a 20~30 ms delay between the onset of SWR and electrical stimulation. Therefore, when disrupting SWRs, the initial part of each SWR is still intact. Even so, we did not find any evidence of SWR-related calcium response following electrical disruption. Lastly, we classified calcium peaks into two groups depending on the presence or absence of SWRs within the preceding 2 s of each peak, considering the slow temporal dynamics of GCaMP6s. Future studies would benefit from the use of calcium indicators with faster dynamics to reveal the timing relation between SWRs and subsequent calcium response in more detail.
In summary, our study presented a new custom-designed microdrive and its application in recording hippocampal activity. We implanted the microdrive in the hippocampus and investigated calcium activity patterns in two different environments from freely behaving animals. Also, we compared calcium activity during intact and disrupted SWRs, which suggests extensive and synchronous participation of neurons during SWR activity. With further analysis, our data can potentially reveal individual cells and cellular ensembles that participate in SWRs, spatial/temporal connections of neurons, and their change over time to coordinate memory processing. Identifying cellular patterns would enable cell- or ensemble-specific SWR disruption to uncover the detailed mechanism of memory formation. Last but not least, although we introduced the application of our microdrive by recording and disrupting hippocampal activity, it can also be adopted to other brain regions with modification of design and implant location.
MATERIAL AVAILABILITY
3D printing files and custom python code used in this study is available at https://bitbucket.org/kloostermannerflab/combined-microdrive-and-miniscope/.
ACKNOWLEDGEMENTS
We are grateful to Jyh-Jang Sun for technical advice and comments on the manuscript, Myeong Seong Bak and Dong Cheol Jang for advice on data analysis, Geehoon Chung for advice on the manuscript, and Emmanuel Paatz for technical support. This work was supported by grants from the National Research Foundation of Korea (NRF-2018R1A5A2025964, 2015H1A2A1034977 and BK21 Plus Project) and Research Foundation Flanders (FWO), Belgium (G0D7516N, C1 grant C14/17/042). The funding sources had no involvement in study design, collection and analysis of data, manuscript, and decision to submit the article to publication.
Figures
Tables
List of manufacturing materials
| 1-1. Tools | |||||
| Item | Company | Model number | Cost/quantity | ||
| Solidwork (CAD software) | Dassault Systèmes, France | ||||
| 3D printer | Formlabs, USA | Form 3 | |||
| Headstage | Neuralynx, USA | HS-18-LED | $1443.95/piece | ||
| Electrode interface board (EIB) | EIB-18 | $104.7/piece | |||
| Thread-forming taps (M1.2 screws) | C.W.S.TOOLS, Belgium | DP2061105-M1.2 Threadformers M1.2 | $54/piece | ||
| 1-2. Consumables | |||||
| Item | Company | Model number | Cost/quantity | Quantity/device | Cost/device |
| Photopolymer resin | Formlabs, USA | RS-F2-GPBK-04 or RS-F2-GPGR-04 | $149/L | 1.20 cm3 | $1.8 |
| Gold EIB pins | Neuralynx, USA | EIB Pins small | $0.16/piece | 10 pieces | $1.6 |
| Female-male breakaway header pins | Male pin: Digikey, USA | ED90328-ND | $0.16/piece | 1 pair | $0.30 |
| Female socket: Farnell, UK | 2840876 | $0.14/piece | |||
| PFA-coated stainless-steel wire | A-M system, USA | 791400 | $1.52/30.5 cm | 10 cm | $0.50 |
| Self-tapping bone screw | Fine Science Tools, Germany | 19010-00 | $0.88/piece | 1 piece | $0.88 |
| Polyimide tubing | Nordson, USA | 141-0001 | $0.20/30.5 cm | 10 cm | $0.07 |
| 23 G tubing | Microgroup, USA | 304 Hypo 23 Gauge Regular Wall (pre-cut length: 1.4 cm) | $0.95/piece | 3 pieces | $2.85 |
| 30 G tubing | 304 Hypo 30 Gauge Regular Wall (pre-cut length: 5.5 cm) | $1.29/piece | 3 pieces | $3.87 | |
| 6mil stainless wire | 304 Round Wire (pre-cut length: 8 cm) | $0.98/piece | 3 pieces | $2.94 | |
| Tetrode wire | Sandvik, Sweden | PX000004 | $0.75/30.5 cm | 30 cm | $0.75 |
| Polyimide-insulated stainless- steel wire | California Fine Wire, USA | .0005 STABLOHM 650 | $0.85/30.5 cm | 10 cm | $0.30 |
| UV-curable dental cement | SDI, Australia | Wave A2 | $10.65/piece | 1/2 piece | $5.33 |
| M 1.2 screws | Micro-Modele, France | DIN84 M1.2x6 | $0.30/piece | 2 pieces | $0.60 |
| Custom-made Microdrive screws (M1.2*0.25) | Advanced Machining &Tooling, Inc, USA | Design on file at AM&T, see [32] | $6.25/piece | 3 pieces | $18.75 |
Recording duration and SWR detection frequency from all animals
| Recording duration (S) | No. of SWR | SWR frequency (Hz) | ||||||
|---|---|---|---|---|---|---|---|---|
| Spontaneous | Disrupted | Spontaneous | Disrupted | Spontaneous | Disrupted | |||
| Animal 1 | 383.0 | 109.0 | 358.0 | 92.0 | 0.93 | 0.84 | ||
| Animal 2 | 260.0 | 320.0 | 41.0 | 220.0 | 0.16 | 0.69 | ||
| Animal 3 | 453.0 | 380.0 | 81.0 | 43.0 | 0.18 | 0.11 | ||
| Animal 4 | 270.0 | 271.0 | 339.0 | 393.0 | 1.26 | 1.45 | ||
References
- Kandel ER (2007) In search of memory: The emergence of a new science of mind. W. W. Norton & Company, New York, NY
- Foster TC, Castro CA, McNaughton BL (1989) Spatial selectivity of rat hippocampal neurons: dependence on preparedness for movement. Science 244:1580-1582


- Buzsáki G, Buhl DL, Harris KD, Csicsvari J, Czéh B, Morozov A (2003) Hippocampal network patterns of activity in the mouse. Neuroscience 116:201-211
- Buzsáki G (2015) Hippocampal sharp wave-ripple: a cognitive biomarker for episodic memory and planning. Hippocampus 25:1073-1188

- Cai DJ, Aharoni D, Shuman T, Shobe J, Biane J, Song W, Wei B, Veshkini M, La-Vu M, Lou J, Flores SE, Kim I, Sano Y, Zhou M, Baumgaertel K, Lavi A, Kamata M, Tuszynski M, Mayford M, Golshani P, Silva AJ (2016) A shared neural ensemble links distinct contextual memories encoded close in time. Nature 534:115-118
- Stamatakis AM, Schachter MJ, Gulati S, Zitelli KT, Malanowski S, Tajik A, Fritz C, Trulson M, Otte SL (2018) Simultaneous optogenetics and cellular resolution calcium imaging during active behavior using a miniaturized microscope. Front Neurosci 12:496
- Scott BB, Thiberge SY, Guo C, Tervo DGR, Brody CD, Karpova AY, Tank DW (2018) Imaging cortical dynamics in GCaMP transgenic rats with a head-mounted widefield macroscope. Neuron 100:1045-1058.e5
- de Groot A, van den Boom BJ, van Genderen RM, Coppens J, van Veldhuijzen J, Bos J, Hoedemaker H, Negrello M, Willuhn I, De Zeeuw CI, Hoogland TM (2020) NINscope, a versatile miniscope for multi-region circuit investigations. Elife 9:e49987
- Buzsáki G (1989) Two-stage model of memory trace formation: a role for "noisy" brain states. Neuroscience 31:551-570
- Benito N, Martín-Vázquez G, Makarova J, Makarov VA, Herreras O (2016) The right hippocampus leads the bilateral integration of gamma-parsed lateralized information. Elife 5:e16658
- Fernández-Ruiz A, Oliva A, Nagy GA, Maurer AP, Berényi A, Buzsáki G (2017) Entorhinal-CA3 dual-input control of spike timing in the hippocampus by theta-gamma coupling. Neuron 93:1213-1226.e5
- Shinohara Y, Hosoya A, Hirase H (2013) Experience enhances gamma oscillations and interhemispheric asymmetry in the hippocampus. Nat Commun 4:1652
- Suzuki SS, Smith GK (1987) Spontaneous EEG spikes in the normal hippocampus. I. Behavioral correlates, laminar profiles and bilateral synchrony. Electroencephalogr Clin Neurophysiol 67:348-359
- Hunt DL, Linaro D, Si B, Romani S, Spruston N (2018) A novel pyramidal cell type promotes sharp-wave synchronization in the hippocampus. Nat Neurosci 21:985-995
- Valeeva G, Nasretdinov A, Rychkova V, Khazipov R (2019) Bilateral synchronization of hippocampal early sharp waves in neonatal rats. Front Cell Neurosci 13:29
- Milner B, Squire LR, Kandel ER (1998) Cognitive neuroscience and the study of memory. Neuron 20:445-468
- Alvarez P, Squire LR (1994) Memory consolidation and the medial temporal lobe: a simple network model. Proc Natl Acad Sci U S A 91:7041-7045
- McClelland JL, McNaughton BL, O'Reilly RC (1995) Why there are complementary learning systems in the hippocampus and neocortex: insights from the successes and failures of connectionist models of learning and memory. Psychol Rev 102:419-457
- Ramadan W, Eschenko O, Sara SJ (2009) Hippocampal sharp wave/ripples during sleep for consolidation of associative memory. PLoS One 4:e6697
- Dupret D, O'Neill J, Pleydell-Bouverie B, Csicsvari J (2010) The reorganization and reactivation of hippocampal maps predict spatial memory performance. Nat Neurosci 13:995-1002
- Roux L, Hu B, Eichler R, Stark E, Buzsáki G (2017) Sharp wave ripples during learning stabilize the hippocampal spatial map. Nat Neurosci 20:845-853
- Tang W, Jadhav SP (2019) Sharp-wave ripples as a signature of hippocampal-prefrontal reactivation for memory during sleep and waking states. Neurobiol Learn Mem 160:11-20
- Girardeau G, Benchenane K, Wiener SI, Buzsáki G, Zugaro MB (2009) Selective suppression of hippocampal ripples impairs spatial memory. Nat Neurosci 12:1222-1223
- Jadhav SP, Kemere C, German PW, Frank LM (2012) Awake hippocampal sharp-wave ripples support spatial memory. Science 336:1454-1458
- Michon F, Sun JJ, Kim CY, Ciliberti D, Kloosterman F (2019) Post-learning hippocampal replay selectively reinforces spatial memory for highly rewarded locations. Curr Biol 29:1436-1444.e5
- Taxidis J, Anastassiou CA, Diba K, Koch C (2015) Local field potentials encode place cell ensemble activation during hippocampal sharp wave ripples. Neuron 87:590-604
- Wilson MA, McNaughton BL (1994) Reactivation of hippocampal ensemble memories during sleep. Science 265:676-679
- O'Neill J, Senior TJ, Allen K, Huxter JR, Csicsvari J (2008) Reactivation of experience-dependent cell assembly patterns in the hippocampus. Nat Neurosci 11:209-215
- Gridchyn I, Schoenenberger P, O'Neill J, Csicsvari J (2020) Assembly-specific disruption of hippocampal replay leads to selective memory deficit. Neuron 106:291-300.e6
- Josselyn SA, Frankland PW (2018) Memory allocation: mechanisms and function. Annu Rev Neurosci 41:389-413
- Dana H, Chen TW, Hu A, Shields BC, Guo C, Looger LL, Kim DS, Svoboda K (2014) Thy1-GCaMP6 transgenic mice for neuronal population imaging in vivo. PLoS One 9:e108697
- Kloosterman F, Davidson TJ, Gomperts SN, Layton SP, Hale G, Nguyen DP, Wilson MA (2009) Micro-drive array for chronic in vivo recording: drive fabrication. J Vis Exp 26:1094
- Nguyen DP, Layton SP, Hale G, Gomperts SN, Davidson TJ, Kloosterman F, Wilson MA (2009) Micro-drive array for chronic in vivo recording: tetrode assembly. J Vis Exp 26:1098
- Ciliberti D, Kloosterman F (2017) Falcon: a highly flexible open-source software for closed-loop neuroscience. J Neural Eng 14:045004
- Pnevmatikakis EA, Soudry D, Gao Y, Machado TA, Merel J, Pfau D, Reardon T, Mu Y, Lacefield C, Yang W, Ahrens M, Bruno R, Jessell TM, Peterka DS, Yuste R, Paninski L (2016) Simultaneous denoising, deconvolution, and demixing of calcium imaging data. Neuron 89:285-299
- Chen TW, Wardill TJ, Sun Y, Pulver SR, Renninger SL, Baohan A, Schreiter ER, Kerr RA, Orger MB, Jayaraman V, Looger LL, Svoboda K, Kim DS (2013) Ultrasensitive fluorescent proteins for imaging neuronal activity. Nature 499:295-300
- Trevathan JK, Asp AJ, Nicolai EN, Trevathan J, Kremer NA, Kozai TDY, Cheng D, Schachter M, Nassi JJ, Otte SL, Parker JG, Lujan JL, Ludwig K (2020) Calcium imaging in freely-moving mice during electrical stimulation of deep brain structures. J Neural Eng. doi: 10.1088/1741-2552/abb7a4
- Zhou H, Neville KR, Goldstein N, Kabu S, Kausar N, Ye R, Nguyen TT, Gelwan N, Hyman BT, Gomperts SN (2019) Cholinergic modulation of hippocampal calcium activity across the sleep-wake cycle. Elife 8:e39777
- Ego-Stengel V, Wilson MA (2010) Disruption of ripple-associated hippocampal activity during rest impairs spatial learning in the rat. Hippocampus 20:1-10
- Karimi Abadchi J, Nazari-Ahangarkolaee M, Gattas S, Bermudez-Contreras E, Luczak A, McNaughton BL, Mohajerani MH (2020) Spatiotemporal patterns of neocortical activity around hippocampal sharp-wave ripples. Elife 9:e51972
- Villette V, Levesque M, Miled A, Gosselin B, Topolnik L (2017) Simple platform for chronic imaging of hippocampal activity during spontaneous behaviour in an awake mouse. Sci Rep 7:43388