Articles

Article Tools
 View Full Text View Full Text |
 Abstract Abstract |
 Article as PDF Article as PDF |
 Print this Article Print this Article |
 Pubmed Pubmed |
 PMC PMC |
 PubReader PubReader |
 Export to Citation Export to Citation |
 Email Alerts Email Alerts |
 Open Access Open Access |
Share this article on :


Stats or Metrics
Article
Original Article
Exp Neurobiol 2022; 31(5): 299-306
Published online October 31, 2022
https://doi.org/10.5607/en22020
© The Korean Society for Brain and Neural Sciences
Synaptic Remodeling of the Auditory Cortex Following Bilateral Blindness: Evidence of Cross-modal Plasticity
Jae Joon Han1†, Tae-Soo Noh2†, Myung-Whan Suh2, Seung Ha Kim3,4, Doo Hee Kim2, Sang Jeong Kim3,4,5* and Seung Ha Oh2*
1Department of Otorhinolaryngology–Head and Neck Surgery, Soonchunhyang University College of Medicine, Seoul Hospital, Seoul 04401, 2Department of Otorhinolaryngology-Head and Neck Surgery, Seoul National University Hospital, Seoul National University College of Medicine, Seoul 03080, 3Department of Physiology, Seoul National University College of Medicine, Seoul 03080, 4Department of Biomedical Sciences, Seoul National University College of Medicine, Seoul 03080, 5Neuroscience Research Institute, Seoul National University College of Natural Sciences, Seoul 03080, Korea
Correspondence to: *To whom correspondence should be addressed.
Sang Jeong Kim, TEL: 82-2-740-8229, FAX: 82-2-763-9667
e-mail: sangjkim@snu.ac.kr
Seung Ha Oh, TEL: 82-2-2072-2442, FAX: 82-2-745-2387
e-mail: shaoh@snu.ac.kr
†These authors contributed equally to this article.
This is an Open Access article distributed under the terms of the Creative Commons Attribution Non-Commercial License (http://creativecommons.org/licenses/by-nc/4.0) which permits unrestricted non-commercial use, distribution, and reproduction in any medium, provided the original work is properly cited.
Abstract
We aimed to evaluate structural dynamic changes of neurons in the auditory cortex after visual deprivation. We longitudinally tracked dendritic spines for 3 weeks after visual deprivation in vivo using a two-photon microscope. GFP-labeled dendritic spines in the auditory cortex were serially followed after bilateral enucleation. The turnover rate, density, and size of the spines in the dendrites were evaluated 1, 2, and 3 weeks after visual deprivation. The turnover rate of the dendritic spines in the auditory cortex increased at 1 week (20.1±7.3%) after bilateral enucleation compared to baseline (12.5±7.9%); the increase persisted for up to 3 weeks (20.9±11.0%). The spine loss rate was slightly higher than the spine gain rate. The average spine density (number of spines per 1 μm of dendrite) was significantly lower at 2 weeks (2W; 0.22±0.06 1/μm) and 3 W (0.22±0.08 1/μm) post-nucleation compared to baseline (0.026±0.09 1/μm). We evaluated the change of synaptic strength in the stable spines at each time point. The normalized spine size in the auditory cortex was significantly increased after bilateral blindness at 1 W postoperatively (1.36±0.92), 2 W postoperatively (1.40±1.18), and 3 W postoperatively (1.36±0.88) compared to baseline. Sensory deprivation resulted in remodeling of the neural circuitry in the spared cortex, via cross-modal plasticity in the direction of partial breakdown of synapses, and enhanced strength of the remaining synapses.
Graphical Abstract
Keywords: Auditory cortex, Cross-modal plasticity, Two-photon, Sensory deprivation
INTRODUCTION
Neuroplasticity refers to the capacity of the nervous system to adapt and reorganize its limited resources in response to environmental changes and experiences [1]. Studies using a range of species, including cats and non-human primates, have reported that abnormal visual experiences during critical periods in development can cause permanent visual impairments, and affect neuroplasticity in the brain [2]. In addition to domain-specific neuroplasticity (such as neuroplastic changes to the visual cortex after visual deprivation), cross-modal plasticity is a known phenomenon of the nervous system. For example, studies have reported enhanced auditory functions in blind patients [3, 4]. In this example of cross-modal plasticity, the deficient sensory function (vision) is compensated for by the remaining senses. When a sensory modality is deficient, the cerebral cortices typically associated with that modality are often reorganized according to the remaining functional sensory domains. For example, many studies of blind patients have reported that the visual cortex is activated by auditory and somatosensory stimuli [5, 6]. Better visual motion detection ability in patients with hearing loss has also been reported [7], where the enhanced visual detection was linked with activation of the auditory cortex [8]. Atypical brain activities in deprived brain cortices can be explained by reorganization of the nervous system as the brain adapts to its environment. Animal studies have directly demonstrated this phenomenon. For example, congenitally deaf cats have shown enhanced visual localization, which could be reversibly deactivated via transient cooling of the auditory cortex [9]. Other studies of deaf animals found increased field potentials in the auditory cortex in response to somatosensory or visual stimulation [10]. Also, it has been reported that this change is involved in the enhancement of sound information processing, which can be seen as a behavioral change in the auditory cortex [11]. Although there has been no study confirming that changes in dendritic spine size induce electrophysiologic and behavioral changes in one experiment, these studies can be inferred.
Despite abundant functional and clinical evidence, the mechanisms underlying cross-modal plasticity at the synaptic level are not fully understood. It is presumed that plastic cortical changes in response to environmental changes result from neural circuit remodeling and rewiring. In juvenile mice, a loss of visual input induced changes in α-amino-3-hydroxy-5-methyl-4-isoxazolepropionic acid (AMPA) receptor-mediated miniature excitatory postsynaptic currents (mEPSC), in both the auditory and somatosensory cortices [12, 13]. Recent advances in in-vivo imaging using two-photon microscopes revealed that an increase of mEPSC amplitude, itself a result of visual deprivation, was associated with an increase in the size of dendritic spines in the deprived cortex [14]. In the somatosensory system, peripheral nerve injury induces remodeling of cortical synapses, as well as changes in the size and density of dendritic spines in the somatosensory cortex [15]. Therefore, we hypothesized that cross-modal plasticity caused by sensory deprivation would induce adaptive remodeling of neural circuits in both the deprived and spared cortices.
To assess the structural change of neural circuits, we assessed the dynamics of individual dendritic spines in the auditory cortex in-vivo using a two-photon microscope. In previous studies of deaf animals, structural changes in neurons were found about 1 month after sensory deprivation [16]. Therefore, we longitudinally tracked dendritic spines for 3 weeks after visual deprivation. To our knowledge, this two-photon imaging study has the longest follow-up period among all such studies.
MATERIALS AND METHODS
The animal study was reviewed and approved by the Institutional Animal Care and Use Committee of Seoul National University Hospital (17-0073-C1A1 (1)).
Animal preparation
All of the experiments were conducted under anesthesia with isoflurane (1%) or Zoletil (30 mg/kg; Virbac, Westlake, TX) with xylazine (10 ml/kg; Bayer AG, Leverkusen, Germany), and the body temperatures of mice were maintained at 36~38℃ using a heating pad (IL-H-80; Live Cell Instrument, Namyangju, Korea). A cranial window was placed on the primary auditory cortex of 42 transgenic mice (Tg(Thy-1-EGFP)MJrs/J, aged 8~9 weeks) purchased from The Jackson Laboratory (Stock No. 007788; Bar Harbor, MN). Some animals were excluded during follow-up because of air bubbles under the cranial window (n=12) or contamination of the cranial window (n=6). Also, some animals did not have the optimal phenotype for this experiment, such as unexplained hearing loss (hearing threshold >40 dB sound pressure level [SPL]), or overexpression of dendrites (n=13). Among the 42 operated animals, 8 were followed-up for the full duration of the experiment (3 weeks post-enucleation); only these animals were included in further analysis.
Experimental procedure
There was a stabilizing period of 2 weeks after placement of the cranial window. Baseline (pre-blindness) imaging was performed 7 days before enucleation (1 W preoperatively), and on the day of enucleation (0 W). Imaging was performed 1, 2 and 3 weeks (1 W, 2 W, and 3 W, respectively, postoperatively) after enucleation.
Before surgery, enucleation, and two-photon imaging, mice were anesthetized with a mixture of zoletil (30 mg/kg) and xylazine (10 mg/kg) via intramuscular administration. All experimental procedure were performed after confirming that the animal was completely anesthetized. As for enucleation, the distal optic nerves were amputated with fine iris scissors, and bilateral eye globes were removed to achieve complete visual deprivation.
Cranial window operation
A 2×2-mm cranial window was made over the left A1 cortex (0.4 and 0.3 cm lateral and posterior to Bregma, respectively) [17]. The scalp was removed and the skull was opened above the A1 cortex. A small craniotomy was carefully performed using a #11 surgical blade [18]. The dura was left intact. The exposed cortex was covered with a polydimethylsiloxane (PDMS) window and the margin between the skull and PDMS was tightly sealed with Vetbond (3M, Maplewood, MN) [19]. The PDMS window was a soft, penetrable, elastic, and transparent silicone-based window ideal for covering the convex auditory cortex [19]. Dexamethasone (0.2 mg/kg) and meloxicam (20 mg/kg) were administered by subcutaneous injection prior to surgery to minimize the potential for edema and inflammation [18, 20]. Imaging sessions started 14~16 days after the surgery. Only one mouse was housed in each cage in the vivarium to minimize stress.
In vivo two-photon microscopy imaging
In-vivo imaging was performed with a two-photon microscope (Zeiss LSM 7 MP; Carl Zeiss, Jena, Germany) equipped with a water immersion objective (Apochromat 20×, numerical aperture=1.0; Carl Zeiss). A Ti:sapphire laser (Chameleon; Coherent, Santa Clara, CA) was tuned to the excitation wavelength for GFP (900~950 nm) [21]. Subsequent image stacks (512×512 pixels; 0.4 μm/pixel, 26 sections) were recorded every 5 min for 1~2 hours. The imaging depth was 50~150 μm below the pial surface, and the dendrites and dendritic spines in Layer II/III of the Layer V pyramidal cells were imaged in this study.
Hearing threshold measurement with auditory brainstem response
To evaluate the hearing status of the animals, the hearing threshold was checked 1 week before the cranial window surgery. The auditory brainstem response (ABR) was measured in a sound-proof chamber with the Smart EP system (Intelligent Hearing Systems, Miami, FL). Subdermal needle electrodes were inserted at the vertex (active electrode), behind the injected ipsilateral ear (reference electrode) and contralateral ear (ground electrode). The earphone tube was inserted gently into the ear canal. Click auditory stimuli were delivered to the target ear. Hearing thresholds were determined by evaluating the lowest stimulus level for waves III/V and SN10 (slow negative wave) recognition, from 90 dB SPL in 5-dB SPL decrements.
Image analysis
ImageJ (NIH, Bethesda, MD) was used to analyze individual spines on the same dendrites from three-dimensional image stacks. Analyses were performed blind to the experimental condition. Detailed criteria for scoring the spines have been described previously [22]. Spine loss and gain rates were determined (percentage of spine elimination and generation between two successive imaging sessions, respectively, relative to the total number of spines in the former session). Spine turnover was defined as the number of lost and gained spines divided by twice the total number of spines from the former session. Spines that survived all imaging sessions were classified as stable [17, 18]. Spine brightness was calculated as described previously, as a measure of spine size [23]. Briefly, only spines that extended from the dendrite in the x-y plane were included. In the best focal section, the intensity values of all pixels comprising the spine were added, and the background from a nearby area (devoid of any GFP-labeled structures) was subtracted. The spine size was then normalized according to the intensity of the adjacent dendrite to account for differences in overall intensity between imaging sessions. To calculate relative changes in spine size at each time point, the spine size was normalized to that at baseline.
Extracellular multi-unit recording of sound-evoked neural activity
To confirm that the anatomic location imaged was the auditory cortex, extracellular multi-unit recordings were performed in two animals. A screw was fixed to the parietal bone and used as the reference electrode. The animals were fixed to the stereotaxic frame and a tungsten wire-based 9-channel microelectrode array (Innovative Neurophysiology, Inc., Durham, NC), (3×3 array, diameter=35 μm, interelectrode spacing=500 μm, 45° angled tip, impedance=300 kΩ) was inserted to a depth of 500 μm perpendicular to the left auditory cortical surface of layer IV. Superficial vessels were carefully avoided.
During recording, Gaussian white noise was produced every 685 ms and introduced into the right ear. Data acquisition, amplification, filtering (by automatic voltage threshold technology), and real-time spike alignment of multichannel signals were performed (MAP system; Plexon Inc., Dallas, TX). The waveform of neural activity was amplified 1,000 times and filtered from 100 to 8,000 Hz. Sound was introduced into the right ear, and recording was performed in the left auditory cortex. Spikes were detected by the auto-gain and auto-threshold technique (Sort Client; Plexon Inc.). Spike sorting was done by unit feature extraction based on principal component analysis. Units were classified using a T-distributed E-M clustering algorithm and artifacts were removed.
The sorted files were processed using NeuroExplorer® (Plexon Inc.) to determine changes in neural activity to repeated stimuli. According to previous research, a peristimulus time histogram (PSTH) of sound-induced unit activity was optimized (observation period: 500 ms, time bin width: 3 ms, number of trials: 200) [24]. We defined an auditory response (synchronized with the stimulus) as a peak amplitude of ≥10 spikes/bin in the PSTH (denoting an increase in action potentials after acoustic stimulation).
Statistical analysis
All results are presented as means±standard deviations. Statistical analyses were performed using SPSS statistical software (ver. 18.0; SPSS, Chicago, IL). p values <0.05 were considered to indicate statistical significance. The change in spine density after enucleation was analyzed using a Wilcoxon signed rank test, for paired comparisons of longitudinal measurements. The spine size was compared before and after enucleation using the paired t-test.
RESULTS
Serial in-vivo imaging of dendritic spines
A total of 184 dendritic spines in 12 dendrites were identified at baseline and tracked for 3 weeks. Among the spines, 98 (33.0%) were classified as stable, 85 (28.3%) as disappearing, 55 (18.3%) as new, and 61 (20.3%) as transient. The total numbers of spines analyzed at baseline and 1 W, 2 W, and 3 W postoperatively were 184, 165, 159, and 154, respectively.
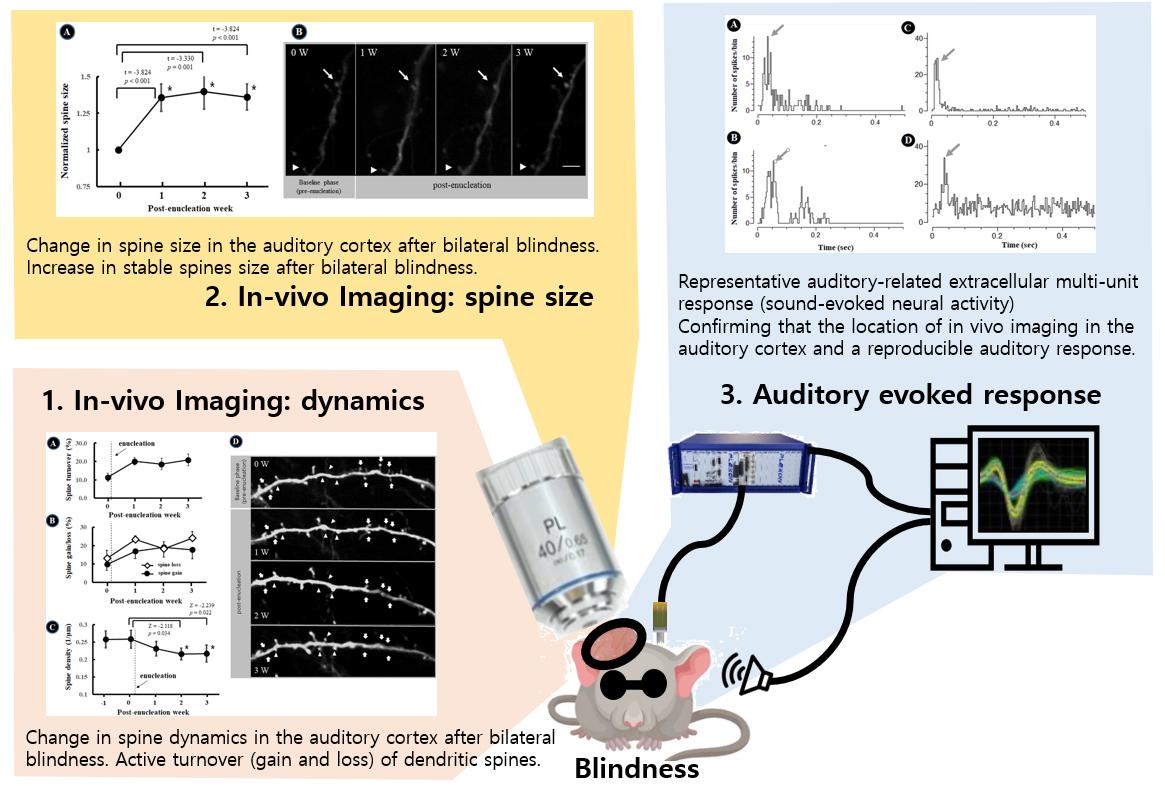
During long-term follow-up with high-resolution imaging of the auditory cortex, a marked increase in spine turnover was observed. The mean turnover rate of dendritic spines in the 12 dendrites across 7 days prior to enucleation was 12.5±7.9%. The 7-day turnover rate increased at 1 W after bilateral enucleation compared to 0W by 20.1±7.3% (p=0.034), at 2 W compared to 1 W postoperatively by 18.6±10.9% (p=0.239), and at 3 W compared to 2 W postoperatively by 20.9±11.0% (p=0.075) (Fig. 1A). The 7-day spine loss rate in the auditory cortex was significantly higher at 1W postoperatively (23.3±7.5%) compared to baseline (i.e., 1 W preoperatively; 13.0±15.2%; p=0.023). At 2 W and 3 W postoperatively, the spine loss rate was also higher compared to the pre-enucleation period (18.2±13.8%, p=0.353; 24.2±12.4%, p=0.052) (Fig. 1B). The 7-day spine gain rate also increased in the auditory cortex after bilateral enucleation, but to a lesser degree than the spine loss rate (baseline, 9.8±11.5%; 1 W postoperatively, 16.9±14.1%, p=0.315; 2 W postoperatively, 19.0±18.3%, p=0.247; 3 W postoperatively, 17.6±16.7%, p=0.353) (Fig. 1B). Consequently, spine density in the auditory cortex was significantly decreased at 2 W (0.22±0.06 1/μm, p=0.034) and 3 W after bilateral enucleation (0.22±0.08 1/μm, p=0.022), compared to pre-enucleation (0.026±0.09 1/μm) (Fig. 1C). Our data showed that visual deprivation resulted in active turnover (gain and loss) of dendritic spines in the auditory cortex, and that dynamic changes of dendritic spines was maintained for 3 weeks after enucleation (Fig. 1D). The overall spine number was decreased due to slight dominance of spine loss over spine gain (Fig. 1C).
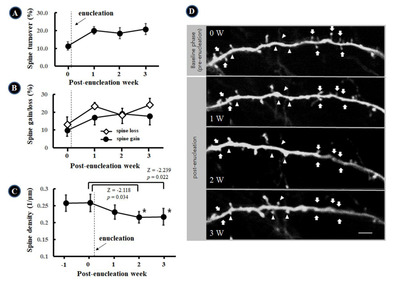
To evaluate the change of synaptic strength, we quantified spine size based on spine brightness, which is monotonically related to spine volume. We serially followed dendritic spines for 3 weeks after enucleation. The spines (n=98) were identified at every time points, at the same sites in 12 dendrites. Compared to the spine size at baseline, i.e., before bilateral enucleation, the stable spines in the auditory cortex significantly increased in size 1 W (1.36±0.92, p<0.001), 2 W (1.40±1.18, p=0.001), and 3 W (1.36±0.88, p<0.001) after bilateral blindness (Fig. 2A and B).
Extracellular multi-unit recording of sound-evoked neural activity
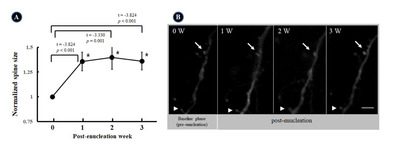
Clear auditory responses were identified in the location where we placed the cranial window and imaged the neurons in-vivo. The PSTH parameters were averaged over all responsive units. The average peak amplitude, peak latency, and sum of the spikes in the PSTH were 20.2±8.4 spikes/bin, 35.3±14.8 ms, and 386.3±405.7 spikes, respectively. These values were consistent with the extracellular multi-unit response to sound stimuli in the auditory cortex reported previously [25]. The inter-trial variability (Fig. 3A vs. B; Fig. 3C vs. D) and inter-individual variability were acceptable (Fig. 3A and B vs. C and D).
DISCUSSION
In this study, we evaluated structural dynamic changes in the auditory cortex after bilateral blindness. To our knowledge, this study is the first to track dendritic spines via long-term (3-week) in-vivo imaging. We were able to stabilize the cranial window in the auditory cortex for 5 weeks (2 weeks prior to and 3 weeks post-enucleation). Furthermore, this study is the first to evaluate the structural remodeling of dendritic spines in the spared cortex [26] after sensory deprivation and cross-modal plasticity. After bilateral blindness due to enucleation, the spine turnover rate increased from 12.5% to 18.6~20.9% (Fig. 1A). The increased turnover rate of dendritic spines persisted for 3 weeks post-bilateral enucleation. Spine density (number of spines per 1 μm of dendrite), was decreased due to the spine loss rate being higher than spine gain rate (Fig. 1B and C). Although the spine density in the auditory cortex was decreased after bilateral blindness, normalized spine size, representing the synaptic strength of stable spines, was significantly increased (Fig. 2). Therefore, we concluded that sensory deprivation resulted in remodeling of the neural circuitry in the spared cortex, in the direction of partial breakdown of synapses, and enhanced the strength of the remaining synapses. These changes in the spared cortex might be related to long-term potentiation and enhanced function of the spared modalities.
Previous studies have reported that sensory deprivation results in up-regulation of excitatory synapses in sensory-deprived cortices. For example, after a few days of dark exposure or bilateral enucleation, synapses in the visual cortex showed increased mEPSC and synaptic density [12-14]. Reinforcement of the synapses was attributed to lateral inputs, i.e., intra-cortical input from higher-order visual areas, or from auditory and somatosensory systems [27, 28]. Thus, changes in synapses after sensory deprivation of the cortex seem to be closely related to the cross-modal plasticity of the spared cortex.
Similar to the neuroplastic changes seen in the deprived cortex, remodeling of neural circuitry in the spared cortex after sensory deprivation was also identified in this study. Interestingly, two different types of cross-modal plasticity were seen in the spared cortex after sensory deprivation. Intra-cortical excitatory synapses in auditory and somatosensory cortices were “scaled down” after visual deprivation, i.e., showed lower-amplitude mEPSC [12, 28]. On the other hand, enhancement of the strength of thalamocortical synapses from layers 4 to Layer 2~3 in the auditory and somatosensory cortices was found [28]. The enhancement of the thalamocortical neural circuits in the auditory cortex was associated with a decrease of the threshold for hearing, as well as increased sensitivity of sound-receptive fields in the auditory cortex [11] after visual deprivation. Our results are in line with these findings. The increased size of dendritic spines may be related with the strengthening of synapses in layer 4 pyramidal cells. Therefore, cross-modal potentiation of neural circuits in the auditory cortex after blindness might be associated with experience-dependent synaptic plasticity and long-term potentiation after sensory deprivation.
Contrary to the increase of dendritic spine size (Fig. 2), the density of dendritic spines in the auditory cortex decreased after blindness (Fig. 1C). There were an increased number of both disappearing and newly generated dendritic spines, resulting in a high turnover rate of the spines (Fig. 1A). Overall, the number of spines decreased due to the spine loss rate exceeding the spine gain rate. Decreased excitatory postsynaptic currents in the auditory cortex after visual loss has also been reported previously. After exposing animals to darkness, intra-cortical synapses scaled down and the amplitude of mEPSC decreased in the spared cortex [11]. This was attributed to the down-scaling of intracortical processing, which relies on feedback from higher-order visual areas. Although long-term results were not provided, it may be that the decrease in mEPSC amplitude was related to a decreased number of spines. We hypothesize that the increased dynamics and turnover of dendritic spines in the auditory cortex after blindness might be related to adaptive changes in the intra-cortical and lateral neural circuitry. Visual deprivation may lead to a breakdown of the intra-cortical pathway within the auditory cortex (between the primary and higher order auditory cortices), or lateral input from other modalities, such as vision.
It should be noted that it took 2 weeks for the spine size to plateau in this study. Most previous studies focused on changes in neural circuits at a single time point, i.e., 1 week after sensory deprivation [28-30]. Short-term observations may not be able to capture the significant synaptic changes that take place after sensory deprivation. Further, observations across at least two time points are needed to understand the sequential changes, and speed thereof, in cross-modal plasticity. We believe that our observations extend prior studies in this regard. It could be argued that 3 weeks is not sufficient to fully explain the clinical and functional improvements in cross-modal sensation; a longer period of observation would be preferable. When planning this study, our goal was to perform in-vivo imaging for 2 months. However, this was not possible due to poor sustainability of the cranial window. Furthermore, it was difficult to prevent some animals from tearing off the window. Even if the window was kept secure, the clarity thereof decreased after 3 weeks, making it impossible to image synapses in vivo. However, as the spine density, turnover rate, and size plateaued within 3 weeks, we may have at least captured the first phase of synaptic changes occurring after sensory deprivation.
In this study, bilateral enucleation enabled us to study synaptic changes in response to complete sensory deprivation. However, it may be difficult to partial out the effect of cross-modal plasticity if sensory deprivation is not complete. Others have attempted to achieve full sensory deprivation via dark exposure [11, 28], cutting the whiskers [29], or chemically ablating the olfactory epithelium [30]. Dark exposure may prevent the animal from obtaining clear visual information, but does not completely eliminate the ascending visual input or cortical processing of visual information. A dark environment provides “degraded” visual information and is thus different from complete sensory deprivation (no visual information). Bilateral sensory deprivation is also critical, since the deprived cortex can obtain information from the other (intact) side. If only one side of olfaction [30] or vision [14] is deprived, a different form of plasticity may be induced that might rely on residual iso-modal sensory function, rather than cross-modal sensory function. Bilateral enucleation is the most complete form of sensory deprivation, which improves the validity of our results.
Although we successfully identified serial structural changes of dendritic spines in the auditory cortex for 3 weeks after visual deprivation, there were some shortcomings to this study that must be addressed. First, we did not evaluate the electrophysiologic neural activity associated with the neuroplastic changes of the neurons. In the future we hope to perform a study evaluating the effect of visual deprivation on the auditory extracellular multi-unit response. In addition, there was no control group (i.e., mice without enucleation or intact visual function) in this study. However, we tracked the dendrites in vivo with two-photon microscopes, and assessed plastic changes 1, 2 and 3 weeks after blindness, where the baseline (before bilateral enucleation) served as the control. Nevertheless, the results would be more reliable if compared to control animals. Also, repeated anesthesia treatment itself may affect dendritic spines in the auditory cortex, and this cannot be completely excluded without analyzing control mice.
ACKNOWLEDGEMENTS
This work was supported by a grant from the National Research Foundation of Korea (NRF), as well as a grant funded by the Korean government (MSIT) (grant numbers 2019R1A2C2004941 and NRF-2018R1A5A2025964).
CONFLICT OF INTEREST
The authors have no other funding, financial relationships, or conflicts of interest to disclose.
Figures
References
- Castaldi E, Lunghi C, Morrone MC (2020) Neuroplasticity in adult human visual cortex. Neurosci Biobehav Rev 112:542-552


- Hubel DH, Wiesel TN, LeVay S (1977) Plasticity of ocular dominance columns in monkey striate cortex. Philos Trans R Soc Lond B Biol Sci 278:377-409
- Lessard N, Paré M, Lepore F, Lassonde M (1998) Early-blind human subjects localize sound sources better than sighted subjects. Nature 395:278-280
- Röder B, Teder-Sälejärvi W, Sterr A, Rösler F, Hillyard SA, Neville HJ (1999) Improved auditory spatial tuning in blind humans. Nature 400:162-166
- Sadato N, Pascual-Leone A, Grafman J, Ibañez V, Deiber MP, Dold G, Hallett M (1996) Activation of the primary visual cortex by Braille reading in blind subjects. Nature 380:526-528
- Weeks R, Horwitz B, Aziz-Sultan A, Tian B, Wessinger CM, Cohen LG, Hallett M, Rauschecker JP (2000) A positron emission tomographic study of auditory localization in the congenitally blind. J Neurosci 20:2664-2672

- Neville HJ, Lawson D (1987) Attention to central and peripheral visual space in a movement detection task: an event-related potential and behavioral study. I. Normal hearing adults. Brain Res 405:253-267
- Finney EM, Fine I, Dobkins KR (2001) Visual stimuli activate auditory cortex in the deaf. Nat Neurosci 4:1171-1173
- Lomber SG, Meredith MA, Kral A (2010) Cross-modal plasticity in specific auditory cortices underlies visual compensations in the deaf. Nat Neurosci 13:1421-1427
- Hunt DL, Yamoah EN, Krubitzer L (2006) Multisensory plasticity in congenitally deaf mice: how are cortical areas functionally specified?. Neuroscience 139:1507-1524
- Petrus E, Isaiah A, Jones AP, Li D, Wang H, Lee HK, Kanold PO (2014) Crossmodal induction of thalamocortical potentiation leads to enhanced information processing in the auditory cortex. Neuron 81:664-673
- Goel A, Jiang B, Xu LW, Song L, Kirkwood A, Lee HK (2006) Cross-modal regulation of synaptic AMPA receptors in primary sensory cortices by visual experience. Nat Neurosci 9:1001-1003
- He K, Petrus E, Gammon N, Lee HK (2012) Distinct sensory requirements for unimodal and cross-modal homeostatic synaptic plasticity. J Neurosci 32:8469-8474
- Keck T, Keller GB, Jacobsen RI, Eysel UT, Bonhoeffer T, Hübener M (2013) Synaptic scaling and homeostatic plasticity in the mouse visual cortex in vivo. Neuron 80:327-334
- Kim SK, Nabekura J (2011) Rapid synaptic remodeling in the adult somatosensory cortex following peripheral nerve injury and its association with neuropathic pain. J Neurosci 31:5477-5482
- Han JJ, Lee HS, Park MH (2018) Neuroplastic change of cytoskeleton in inferior colliculus after auditory deafferentation. Hear Res 367:207-212
- Franklin KB, Paxinos G (2008) The mouse brain in stereotaxic coordinates. 3rd ed. Academic Press, San Diego, CA
- Jin Y, Dougherty SE, Wood K, Sun L, Cudmore RH, Abdalla A, Kannan G, Pletnikov M, Hashemi P, Linden DJ (2016) Regrowth of serotonin axons in the adult mouse brain following injury. Neuron 91:748-762
- Heo C, Park H, Kim YT, Baeg E, Kim YH, Kim SG, Suh M (2016) A soft, transparent, freely accessible cranial window for chronic imaging and electrophysiology. Sci Rep 6:27818
- Otazu GH, Chae H, Davis MB, Albeanu DF (2015) Cortical feedback decorrelates olfactory bulb output in awake mice. Neuron 86:1461-1477
- Wake H, Moorhouse AJ, Jinno S, Kohsaka S, Nabekura J (2009) Resting microglia directly monitor the functional state of synapses in vivo and determine the fate of ischemic terminals. J Neurosci 29:3974-3980
- Holtmaat AJ, Trachtenberg JT, Wilbrecht L, Shepherd GM, Zhang X, Knott GW, Svoboda K (2005) Transient and persistent dendritic spines in the neocortex in vivo. Neuron 45:279-291
- Hofer SB, Mrsic-Flogel TD, Bonhoeffer T, Hübener M (2009) Experience leaves a lasting structural trace in cortical circuits. Nature 457:313-317
- Shimazaki H, Shinomoto S (2007) A method for selecting the bin size of a time histogram. Neural Comput 19:1503-1527
- Park SK, Lee SY, Kim DH, Lee MY, Oh SH (2019) Auditory cortical plasticity and reorganization in rats with single-sided deafness during early developmental period. Ann Otol Rhinol Laryngol 128(6 Suppl):16S-25S
- Lee MY, Kim DH, Park SK, Jun SB, Lee Y, Choi JJ, Yoo HJ, Raphael Y, Oh SH (2017) Disappearance of contralateral dominant neural activity of auditory cortex after single-sided deafness in adult rats. Neurosci Lett 657:171-178
- Iurilli G, Ghezzi D, Olcese U, Lassi G, Nazzaro C, Tonini R, Tucci V, Benfenati F, Medini P (2012) Sound-driven synaptic inhibition in primary visual cortex. Neuron 73:814-828
- Petrus E, Rodriguez G, Patterson R, Connor B, Kanold PO, Lee HK (2015) Vision loss shifts the balance of feedforward and intracortical circuits in opposite directions in mouse primary auditory and visual cortices. J Neurosci 35:8790-8801
- Ye B, Huang L, Gao Z, Chen P, Ni H, Guan S, Zhu Y, Wang JH (2012) The functional upregulation of piriform cortex is associated with cross-modal plasticity in loss of whisker tactile inputs. PLoS One 7:e41986
- Ni H, Huang L, Chen N, Zhang F, Liu D, Ge M, Guan S, Zhu Y, Wang JH (2010) Upregulation of barrel GABAergic neurons is associated with cross-modal plasticity in olfactory deficit. PLoS One 5:e13736