Articles

Article Tools
 View Full Text View Full Text |
 Abstract Abstract |
 Article as PDF Article as PDF |
 Print this Article Print this Article |
 Pubmed Pubmed |
 PMC PMC |
 PubReader PubReader |
 Export to Citation Export to Citation |
 Email Alerts Email Alerts |
 Open Access Open Access |
Share this article on :


Stats or Metrics
Article
Original Article
Exp Neurobiol 2014; 23(3): 215-223
Published online September 30, 2014
https://doi.org/10.5607/en.2014.23.3.215
© The Korean Society for Brain and Neural Sciences
Implementation of a Two-dimensional Behavior Matrix to Distinguish Individuals with Differential Depression States in a Rodent Model of Depression
Jin-Young Park1#, Tae-Kyung Kim1#, Juli Choi1, Jung-Eun Lee1, Hannah Kim1, Eun-Hwa Lee1 and Pyung-Lim Han1,2,3*
Departments of 1Brain and Cognitive Sciences, 2Chemistry and Nano Science, and 3Brain Disease Research Institute, Ewha Womans University, Seoul 120-750, Korea
Correspondence to: *To whom correspondence should be addressed.
TEL: 82-2-3277-4130, FAX: 82-2-3277-3419
e-mail: plhan@ewha.ac.kr
#These authors contributed equally to this work.
Animal models of depression are used to study pathophysiology of depression and to advance therapeutic strategies. Stress-induced depression models in rodents are widely used. However, amenable behavioral criteria and experimental procedures that are suitable for animal models have not been established. Given that depression is clinically diagnosed by multiple symptomatic criteria and stress effects are imposed to the brain non-specifically in stress-induced depression models, analyses of depression states in rodents using multiple symptomatic criteria may provide more power than any methods relying on a single symptomatic criterion. To address this, C57BL/6 inbred mice were restrained for 2 h daily for 14 d, and depression states of individual mice were assessed using the U-field test, behavioral assessment developed to measure animal's sociability, and the tail suspension test and/or forced swim test, which are the typical methods that measure psychomotor withdrawal states. Although the majority of these mice showed severe depressive behaviors in both tests, a significant proportion of them, which were all inbred mice and received the same amount of restraints, expressed differential depression states in the sociability test and psychomotor withdrawal tests. To easily read-out differential depression states of individuals in two different tests, a standard method and basic parameters required to construct two-way behavior matrix were introduced. The utility and features of this two-way behavior analysis method for studies of different depressive states of individuals were discussed.
Keywords: depression, sociability, psychomotor retardation, U-field test
INTRODUCTION
Depression is a mood disorder characterized by depressed mood, diminished interests in daily life, and psychomotor retardation [1]. These symptoms range from emotional, cognitive to physiological signs. Depression is caused by various reasons which include genetic and environmental factors. Failure of stresscoping appears to be a leading cause of depression [2]. Animal models are used to study the mechanisms of depression and to develop effective therapeutic strategies. Stress-induced depression models in rodents are widely used in recent years. However, representative symptomatic criteria and experimental procedures that are suitable for animal models of depression have not been established.
The most widely used methods for depression states in rodent models are the forced swim test (FST) and tail suspension test (TST) [3, 4, 5, 6, 7, 8]. The FST and TST have high predictive values to evaluate the pharmacological efficacy of current antidepressants. However, because both tests use immobility time as a measured variable [9, 10], it has been criticized whether they provide insights into the etiology and the pathogenesis of clinical depression [11, 12, 13]. Sociability is another behavioral marker that has been actively used to measure depression states in recent years [8, 14, 15]. Because sociability is often suppressed in people with depression [16, 17] and a neurobehavioral correlation of sociability is figurative in rodents, sociability may be chosen as a behavioral marker for rodent models. In fact, reduced sociability in rodent models of depression improved after treatment with current antidepressants [8, 14, 18, 19]. Given that depression is clinically diagnosed by multiple symptomatic criteria and stress effects are imposed to the body non-specifically in stress-induced depression models, it is necessary to analyze depression states of individuals using multiple symptomatic criteria and this approach should be more powerful than any methods relying on a single behavioral symptom.
In the present study, we developed a two-dimensional behavior analysis matrix that was constructed using the results of sociability and psychomotor withdrawal tests and their potential utilities were discussed.
MATERIALS AND METHODS
Male C57BL/6 inbred mice at seven weeks of age were purchased from Daehan BioLink, Inc. (Eumsung, Chungbuk, Korea). They were housed in pairs in standard clear plastic cages, with
Restraint was applied to mice as previously described [8, 20]. Briefly, mice were acclimated in the animal room for a week, after which the mice were individually restrained for 2 h per day in a 50-ml polypropylene conical tube with ventilation holes. After each session of restraint, the mice were housed in their home cage under regular housing conditions. This daily restraint was repeated for 14 consecutive days (2 h×14 d RST for short).
Imipramine (I0899; Sigma-Aldrich, St. Louis, MO, USA) was intraperitoneally (i.p.) administered at a dose of 20 mg/kg in 120 µl of 0.9% saline. Each injection was given at 10 A.M. and this was repeated for 14 consecutive days.
The U-filed test was monitored using a computerized video tracking system (SMART, Panlab, Spain). A webcam recording system (HD Webcam C210, Logitech, USA) was used to record behavioral performances in the TST and FST. Behavioral tests were carried out during the light cycle (9 A.M.~3 P.M.). The behavior testing room was lit with indirect illumination by 20 lux for the U-field Test and 250 lux for TST and FST, and sound was masked with 65 dB of white noise. After each behavioral test, all parts of the apparatus (including the U-field and grid cages) that were exposed to mice were cleaned with 70% ethanol before starting the next test. Mice were given for 20 min to adapt to the behavior testing room, prior to the start of each behavioral test.
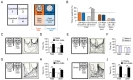
The U-field test was described in a previous report [8]. The U-field consisted of two symmetrical rectangular fields that were defined by partitioning an open field (40×40 cm2) with a wall (20 cm) to the central point, so that each field had closed (quadrants 1 and 3) and open (quadrants 2 and 4) squares, forming a "U-shaped field" (Fig. 1A). A circular grid cage (12 cm in diameter×33 cm height) was placed on each side of the closed square. The closed square (quadrant 1) containing a social target in a grid cage was defined as the target-zone, whereas the closed square (quadrant 3) with an unanimated cage was defined as the non-target zone (Fig. 1A). Likewise, the relevant fields were defined as the target and non-target fields, and the target zone and the target field were defined as the social interaction zone and the social interaction field, respectively. The apparatus was built using cream-colored FOAMEX (Expanded PVC; LG Ltd., Korea) to form the open field and the middle partition.
Cage-mates were housed together in a home cage for more than 1 week prior to behavioral tests, whereas non-mates had never been exposed to subject mice. Cage-mates and non-mates all had the same genetic background (C57BL/6) and were male. The mice that were used as social targets were 2 weeks older than subject. All animals were kept in pairs in normal clear plastic cages prior to the U-field test, and there was no bedding change or moving of the cages the day before the U-field test.
After adaptation to the test room for 20 min, each subject mouse was allowed to freely explore the unanimated U-field for 5 min and its behavioral performance was recorded. After 5 min, the subject mouse was returned to its home cage for 2 min. While the subject mouse was placed in the home cage, a social target was loaded in the grid cage placed in the target zone. When the target mouse was stabilized in the grid cage, the subject mouse was placed in the center of the U-field, such that it could see both zones. The subject mouse was allowed to explore for 5 min or for the indicated time in the U-field, and the time and the trajectory spent in the zones and fields were recorded. For each session, the social target was replaced with other mice, with each being exposed to the test less than 3 times in total.
The TST was performed as described previously [8]. Mice were suspended individually by their tails from a wooden shelf 50 cm height above the surface of a table in the test room. The tip of the tail was fixed using adhesive tape. Each subject was suspended by the tail for 6 min and immobility time was recorded.
The FST was performed as described previously [8]. Mice were placed in a Plexiglas cylinder (15 cm in diameter×27 cm in height) containing water at 24℃ with a depth of 14 cm. Mice were individually placed in the cylinder for 6 min. Immobility time, which was defined as the sum of time during which mice remained floating with all limbs motionless, was quantified during the last 5 min.
Two-sample comparisons were carried out using the Student's
Male C57BL/6 inbred mice were allowed to freely explore the U-field, individually, which contained unanimated grid cages on each side for 5 min. They preferred closed zones (quadrants 1 and 3), but explored both sides evenly in the test (Fig. 1A and B). Given the choice of mate vs. non-mate, subject mice spent 31.44% and 53.99% of the time in the mate and non-mate zones, respectively, and 37.93% and 62.07% in the mate and non-mate fields, respectively (Fig. 1C and D). Given the choice of cage mates on both sides, subject mice explored for 40.68% and 37.64% of the time in mate zone A and mate zone B, respectively, and 51.89% and 48.11% in mate field A and mate field B, respectively (Fig. 1E and F). These results suggest that the behavioral preference of mice read-out by the U-field test was not due to the suppression of sociability to mate, but an increase in behavioral preference for unfamiliar mice.
When presented with unanimated vs. non-mate cages, subject mice explored for 25.66% and 54.0% of the time in unanimated and non-mate zones, respectively, and 34.63% and 65.37% in unanimated and non-mate fields, respectively (Fig. 1G and H). Given the choice of empty vs. non-mate cages, the subject mice explored for 14.41% and 71.12% of the time in empty and nonmate zones, respectively, and 21.19% and 78.81% in empty and non-mate fields, respectively (Fig. 1I and J).
These results suggest that quantitative levels of sociability were influenced by environmental contexts and that the U-field test can read-out differential levels of sociability. In the following experiments, we carried out the U-field test with unanimated vs. non-mate cages as a standard procedure.
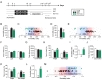
Mice were restrained for 2 h daily for 14 d and their depression states were examined using the FST, TST and the U-field test (Fig. 2A). The mice treated with 2 h×14 d RST showed increased immobility in both the FST and TST, whereas treatment with imipramine in the post-stress period reversed the increased immobility to control levels (Fig. 2B and D).
Behavioral performances of individuals in FST and TST were visualized by plotting them as a function of immobility time (Fig. 2C and E). After the 2 h×14 d RST, the % of individuals whose behavioral performance shifted over one-standard deviation (one-SD) from the mean immobility of the control were 80.65% and 76.92% in the FST and TST, respectively. In contrast, significant numbers of individuals (19.35% and 23.08%, respectively) exhibited their immobility within one-SD of the control, thus being indistinguishable from the control, in these tests (Fig. 2C and E).
Prior to the U-field test, all subject mice were allowed to freely explore the un-animated U-field for 5 min to habituate to the U-field. All three groups of mice (control, RST, and RST+imi) explored both sides of the U-field for similar amounts of time (Fig. 2F), and the locomotor activity of each group was not different (Fig. 2G).
In the U-field test, control mice spent 65.0% and 54.0% of the time in the target field and zone, respectively, whereas mice exposed to the 2 h×14 d RST stayed for 49.4% and 40.1% of the time in the target field and zone, respectively, while increasing dwelling time in the non-target field and zone (Fig. 2H and K). Conversely, post-stress treatment with imipramine reversed behavioral performance in each field and zone to the levels of the control (Fig. 2H and K). During the U-field test, the general locomotor activities of mice with 2 h×14 d RST, and mice with RST+imi were slightly reduced (Fig. 2J).
Behavioral performances in the target and non-target zones were integrated into the sociability index (SIz), which was defined as [the percent time spent in the target zone minus the percent time in the non-target zone] divided by [the percent time spent in the target zone plus the percent time in the non-target zone]. The 2 h×14 d RST reduced the sociability index (SIz) score from 0.36 to 0.02, but imipramine treatment increased it to 0.45 (Fig. 2L). Sociability index for behavioral performances in the field (SIf) were expressed in a similar way (Fig. 2I).
The behavioral performance of individual mice plotted as a function of the sociability index indicated that while more than half of RST individuals (55.56%) were shifted over one-SD from the mean of the control, a significant number (41.67%) positioned within one-SD from the mean of the control, thus being indistinguishable from the control, in the sociability test. On the other hand, imipramine treatment had 85.71% of the RST individuals reposition within one-SD from the mean of the control (Fig. 2M).
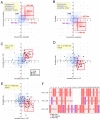
The behavioral performances of individuals presented on the matrix of TST×FST, TST×U-field test, and FST×U-field test were reanalyzed. For easy comparisons, each of behavioral performance was converted into a z score: z = (x-µ)/σ, where×is an individual behavioral performance, µ is the mean of performance of the control, and σ is one standard deviation of the control, and then each converted performance was then plotted on the matrix.
The two-way behavioral matrix consisting of TST×FST indicated that the overall distributions had a regression correlation coefficient of
Similar analyses with the two-way behavior matrix consisting of TST×U-field test or of FST×U-field test allowed us to identify (i) individuals with low sociability and near-normal psychomotor withdrawal (depression with poor sociability, RST-Ds), (ii) individuals with near-normal sociability and high psychomotor withdrawal (depression with psychomotor withdrawal, RST-Dps), and (iii) individuals with low sociability and high psychomotor withdrawal (RST-DD) (Fig. 3B).
After being exposed to 2 h×14 d RST, approximately 36.0% (9/25) of individuals were RST-DD in the matrix of U-field×TST, and 43.3% (13/30) were RST-DD in the U-field×FST, whereas 56.0% (14/25) or 43.3% (13/30) were depressive only in the U-field test or TST/FST, respectively. Among 14 individuals marked by RST-DD on the matrix of FST×TST, fewer than half (6 or 7) were reidentified as RST-DD on the U-field×TST/FST (Fig. 3C-E).
The two-way behavioral matrix also allowed for identifying stress resilient individuals (RST-RSL) which distributed within one-SD of the mean of the control in the U-field×TST/FST (Fig. 3F). This means that RST-RSL individuals were behaviorally indistinguishable from the controls in any of the two behavioral tests.
These results suggest that the two-way behavior matrix provides advanced resolving power that can distinguish differential depression states of individuals compared to any methods that analyze animal's emotional states with sociability or psychomotor withdrawal alone.
The present study used the U-field test to distinguish behavioral states of depression. Sociability has many features that make it as an appropriate behavioral marker for distinguishing multiple depression states in rodent models. First, diminished sociability is a symptom of human depression [16]. Second, rodents are normally sociable so that additional positive or negative reinforcement that is often implemented in behavioral tests is not necessary.
In terms of sensitivity and utility for differentiating behavioral states of depression, the U-field test is comparable to the TST and FST, which have been predominately used to measure depression states in rodent models [5, 6]. First, the U-field test offers a methodological effectiveness for measuring depression states, as do the TST and FST. For instance, it successfully differentiated animals exposed to the 2 h×14 d RST from the control. The resolving power of the U-field test to differentiate behavioral states of CON
The U-field test measured sociability, a behavioral phenotype which was different from the behavioral states measured by the TST and FST, but like the TST and FST, it provided the pharmacological validity of imipramine (Fig. 2). Previously, the TST and FST had been assumed to measure behavioral despair produced by forceful experiences of hopelessness and helplessness [9, 10, 13]. However, behavioral despair is experimenter-oriented and abstractive concept, whereas what scientists actually measure by the TST and FST is immobility time. The results of the present study including the fact that the pharmacological validity of the FST and TST was reproduced by the U-field test (Fig. 3) support the envision that the TST and FST measure psychomotor retardation, which were previously proposed [21, 22, 23] and is a core symptom of depression suggested by the Diagnostic and Statistical Manual of Mental Disorders (DSM-V).
The two-way behavioral matrix can be used not only to measure behavioral performance of a group of animals, but also to differentiate different depression states of individuals. For example, the two-way matrix differentiates behavioral states with normal sociability and psychomotor withdrawal, which we referred to (i) RST-RSL individuals, (ii) behavioral states with normal sociability and high psychomotor withdrawal, (iii) behavioral states with low sociability and normal psychomotor withdrawal, and (iv) behavioral states with low sociability and high psychomotor withdrawal, referred to "RST-DD" (Fig. 3A and B). The RST-DD and RST-RSL individuals may have some similarity to susceptible and resilient mice, respectively, which were isolated on the basis of sociability alone [15].
Individual animals determined to be depressive by the TST and FST are not necessarily defective in psychomotor activity alone, but presumably in other symptoms as well. Similarly, individuals determined to be depressive by the U-field test are not necessarily defective in sociability alone, but presumably in other symptoms as well. Based on the same rationale, the two-way behavioral matrix may be expanded to the analyses of any two different behaviors, such as sociability vs. anhedonia, sociability vs. anxiety, sociability vs. cognition, or psychomotor withdrawal vs. anxiety, although these lines of inquiry were not perused in the present study. In any cases, behavioral analysis with the two-way behavioral matrix should have advanced resolving power to distinguish individuals with different depression states compared with those measured by a single behavioral symptomatic criterion.
The present study showed that one-SD from the mean value of the control can be used as a criterion to differentiate depression states on the two-way behavior matrix. When behavioral responses in the U-field test, TST or FST were significantly different between control and RST animals, the mean performance value for RST animals was usually distributed outside of one-SD (one unit of the z score) from the respective mean value of the control. The results of the TST and FST are the cases (Fig. 2). After being treated with 2 h×14 d RST, approximately 30-50% of individuals were distributed within one-SD of the control in the U-field test, TST or FST. The individuals distributed within one-SD of the control were behaviorally indistinguishable from the controls. The usefulness of one-SD as a criterion to differentiate depression states of individuals may be supported by identifying genes whose expressions are changed in parallel to the behavioral states of RST-DD and RST-RSL individuals, and this attempt is in progress in our laboratory.
The C57BL/6 strain is an inbred line of mice, and therefore genetically homogeneous. After being exposed to the 2 h×14 d RST, some C57BL/6 individuals (RST-RSL in Fig. 3) behaved like the untreated control mice in the U-field test and in the FST and TST, suggesting that a subset of C57BL/6 mice successfully coped with the 2 h×14 d RST at the behavioral level. These results suggest that differential distributions of individuals with the 2 h×14 d RST on the two-way behavioral matrix may represent the occurrence of differential genomic responses at the molecular level.
Various epigenetic mechanisms have been suggested to be associated with depression [24, 25, 26]. Differential behavioral and molecular responses to the 2 h×14 d RST might be attributed to epigenetic predispositions of anti-depression signatures in the brain before birth, after birth, or long before behavioral tests were performed. Alternatively, it is possible that differential behavioral and molecular responses were induced and deposited stochastically among individuals during the stress coping period, possibly as a result of the interaction between the current brain states and stress imposed.
- American Psychiatric Association. Diagnostic and statistical manual of mental disorders. 5th ed. Washington, D.C.: American Psychiatric Association, 2013.
- Hammen C. Stress and depression. Annu Rev Clin Psychol 2005;1:293-319.

- Cryan JF, Markou A, Lucki I. Assessing antidepressant activity in rodents: recent developments and future needs. Trends Pharmacol Sci 2002;23:238-245.
- Cryan JF, Mombereau C. In search of a depressed mouse: utility of models for studying depression-related behavior in genetically modified mice. Mol Psychiatry 2004;9:326-357.
- Petit-Demouliere B, Chenu F, Bourin M. Forced swimming test in mice: a review of antidepressant activity. Psychopharmacology (Berl) 2005;177:245-255.
- Cryan JF, Holmes A. The ascent of mouse: advances in modelling human depression and anxiety. Nat Rev Drug Discov 2005;4:775-790.
- Krishnan V, Nestler EJ. Animal models of depression: molecular perspectives. Curr Top Behav Neurosci 2011;7:121-147.
- Seo JS, Park JY, Choi J, Kim TK, Shin JH, Lee JK, Han PL. NADPH oxidase mediates depressive behavior induced by chronic stress in mice. J Neurosci 2012;32:9690-9699.
- Porsolt RD, Bertin A, Jalfre M. Behavioral despair in mice: a primary screening test for antidepressants. Arch Int Pharmacodyn Ther 1977;229:327-336.
- Steru L, Chermat R, Thierry B, Simon P. The tail suspension test: a new method for screening antidepressants in mice. Psychopharmacology (Berl) 1985;85:367-370.
- Borsini F, Volterra G, Meli A. Does the behavioral "despair" test measure "despair"?. Physiol Behav 1986;38:385-386.
- Borsini F, Meli A. Is the forced swimming test a suitable model for revealing antidepressant activity?. Psychopharmacology (Berl) 1988;94:147-160.
- Willner P. The validity of animal models of depression. Psychopharmacology (Berl) 1984;83:1-16.
- Berton O, McClung CA, Dileone RJ, Krishnan V, Renthal W, Russo SJ, Graham D, Tsankova NM, Bolanos CA, Rios M, Monteggia LM, Self DW, Nestler EJ. Essential role of BDNF in the mesolimbic dopamine pathway in social defeat stress. Science 2006;311:864-868.
- Krishnan V, Han MH, Graham DL, Berton O, Renthal W, Russo SJ, Laplant Q, Graham A, Lutter M, Lagace DC, Ghose S, Reister R, Tannous P, Green TA, Neve RL, Chakravarty S, Kumar A, Eisch AJ, Self DW, Lee FS, Tamminga CA, Cooper DC, Gershenfeld HK, Nestler EJ. Molecular adaptations underlying susceptibility and resistance to social defeat in brain reward regions. Cell 2007;131:391-404.
- Kessler RC, Berglund P, Demler O, Jin R, Koretz D, Merikangas KR, Rush AJ, Walters EE, Wang PS, National Comorbidity Survey Replication. The epidemiology of major depressive disorder: results from the National Comorbidity Survey Replication (NCS-R). JAMA 2003;289:3095-3105.
- Kessler RC, Chiu WT, Demler O, Merikangas KR, Walters EE. Prevalence, severity, and comorbidity of 12-month DSM-IV disorders in the National Comorbidity Survey Replication. Arch Gen Psychiatry 2005;62:617-627.
- Tsankova NM, Berton O, Renthal W, Kumar A, Neve RL, Nestler EJ. Sustained hippocampal chromatin regulation in a mouse model of depression and antidepressant action. Nat Neurosci 2006;9:519-525.
- Elliott E, Ezra-Nevo G, Regev L, Neufeld-Cohen A, Chen A. Resilience to social stress coincides with functional DNA methylation of the Crf gene in adult mice. Nat Neurosci 2010;13:1351-1353.
- Kim KS, Han PL. Optimization of chronic stress paradigms using anxiety- and depression-like behavioral parameters. J Neurosci Res 2006;83:497-507.
- Sibille E, Sarnyai Z, Benjamin D, Gal J, Baker H, Toth M. Antisense inhibition of 5-hydroxytryptamine2a receptor induces an antidepressant-like effect in mice. Mol Pharmacol 1997;52:1056-1063.
- Rachman IM, Unnerstall JR, Pfaff DW, Cohen RS. Estrogen alters behavior and forebrain c-fos expression in ovariectomized rats subjected to the forced swim test. Proc Natl Acad Sci U S A 1998;95:13941-13946.
- Skelin I, Kovačević T, Sato H, Diksic M. The opposite effect of a 5-HT1B receptor agonist on 5-HT synthesis, as well as its resistant counterpart, in an animal model of depression. Brain Res Bull 2012;88:477-486.
- Franklin TB, Saab BJ, Mansuy IM. Neural mechanisms of stress resilience and vulnerability. Neuron 2012;75:747-761.
- Vialou V, Feng J, Robison AJ, Nestler EJ. Epigenetic mechanisms of depression and antidepressant action. Annu Rev Pharmacol Toxicol 2013;53:59-87.
- Sun H, Kennedy PJ, Nestler EJ. Epigenetics of the depressed brain: role of histone acetylation and methylation. Neuropsychopharmacology 2013;38:124-137.