Articles

Article Tools
 View Full Text View Full Text |
 Abstract Abstract |
 Article as PDF Article as PDF |
 Print this Article Print this Article |
 Pubmed Pubmed |
 PMC PMC |
 PubReader PubReader |
 Export to Citation Export to Citation |
 Email Alerts Email Alerts |
 Open Access Open Access |
Share this article on :


Stats or Metrics
Article
Original Article
Exp Neurobiol 2018; 27(6): 574-592
Published online December 28, 2018
https://doi.org/10.5607/en.2018.27.6.574
© The Korean Society for Brain and Neural Sciences
Spheroid Culture of Mammalian Olfactory Receptor Neurons: Potential Applications for a Bioelectronic Nose
Samhwan Kim1, So Yeun Kim1,2, Seong-Kyun Choi3, Jisub Bae1, Won Bae Jeon4, Jae Eun Jang5, and Cheil Moon1,2*
1Department of Brain and Cognitive Sciences, Daegu Gyeongbuk Institute of Science and Technology, Daegu 42988, Korea.
2Convergence Research Advanced Centre for Olfaction, Daegu Gyeongbuk Institute of Science and Technology, Daegu 42988, Korea.
3Core Protein Resources Center, Daegu Gyeongbuk Institute of Science and Technology, Daegu 42988, Korea.
4Companion Diagnostics and Medical Technology Research Group, Daegu Gyeongbuk Institute of Science and Technology, Daegu 42988, Korea.
5Department of Information and Communication Engineering, Daegu Gyeongbuk Institute of Science and Technology, Daegu 42988, Korea.
Correspondence to: *To whom correspondence should be addressed.
TEL: 82-53-785-6110, FAX: 82-53-785-6109
e-mail: cmoon@dgist.ac.kr
Abstract
The olfactory system can detect many odorants with high sensitivity and selectivity based on the expression of nearly a thousand types of olfactory receptors (ORs) in olfactory receptor neurons (ORNs). These ORs have a dynamic odorant detection range and contribute to signal encoding processes in the olfactory bulb (OB). To harness the capabilities of the olfactory system and develop a biomimetic sensor, stable culture and maintenance of ORNs are required. However,
Graphical Abstract
Keywords: Cell-based biosensor, Recombinant protein, Olfactory receptor neuron, Spheroid culture, Micro electrode array
INTRODUCTION
The olfactory system is a sophisticatedly engineered and accurate odor-detector. Odors go into the nasal cavity and bind to ORs expressed on the ciliary membrane of ORNs. Binding of odor molecules activates an olfactory signal transduction cascade and these signals are transferred to the OB in which collected signals are primarily processed before they are sent to the brain; these processes take place within hundreds of a millisecond [1]. ORNs interact directly with odor molecules and are a key element of the odor-detection process. To detect and distinguish between numerous type of odor molecules, ORs are expressed on the ciliary membrane of ORNs; each ORN expresses a single type of OR [2,3,4]. A single OR can interact with multiple odors and has odor-dependent binding affinities [5,6] , moreover, approximately 400 and 1000 ORs are expressed in the human and rat olfactory epithelium, respectively [7,8]. In this regard, a combination of the number of expressed ORs and measurable odors by a single OR generate distinct odor-dependent signal patterns which are a fundamental mechanism enabling the detection of numerous odors within the olfactory system [6]. Odorant detection by the olfactory system has inspired the development of olfactory mimetic biosensors [9,10,11,12,13]. Although ORs have been used practically for a variety of bioelements, limitations remain (eg, reliability and stability of odor measurements and technical difficulties in the preparation and modification of ORs). In contrast, ORNs may be an ideal biological element for odor detection due to the innate expression of ORs and the generation of specific odorant-dependent signals. Therefore, numerous ORs can detect many odorants with high selectivity and sensitivity. Additionally, ORNs express the signal transduction molecules necessary for olfactory signaling, thus facilitating repetitive odorant measurement following continuous odorant stimulation. This capability can be better leveraged as a bioelement compared to OR-based bioelectronic noses. However, difficulties with storage and cell culture are limitations associated with using ORNs as bioelements.
Therefore, in this study, we developed a spheroid culture model to overcome the limitations of previous primary ORN culture techniques for use as a bioelement of an electronic nose. Spheroid culture is a method of culturing cells in a spherical shape and is mainly used in the preservation and proliferation of stem cells [14,15]. We utilized a spheroid culture approach based on a previous culture method and verified stable formation of ORN precursor spheroids using a recombinant protein (REP). Next, we qualitatively assessed maintenance of stemness, viability, and physiological characteristics. Lastly, an odorant-detecting biosensor was developed using spheroid cultures of ORN precursors and multi electrode array (MEA). By applying this spheroid culture technique, the stability of cultured ORN precursors could be improved; by measuring the electrical signals generated in the ORNs upon odorant stimulation, we verified that the ORN spheroid culture could be applied to a bioelectronics nose system. This technique could also be a useful method for developing a high-throughput odorant screening system and various industrial applications.
MATERIALS AND METHODS
To form ORN precursor spheroids, 96 well plate (Thermo Scientific) was coated with 100 µl of 3 µM REP diluted in PBS and incubated for one hour in a humidified (37℃) incubator and 5% CO2. After one hour, REP solution was aspirated and 1×10⁶ cells/ml dissociated ORN precursor suspension was plated on the 96 plate. After 24 hours, ORN precursor spheroids were formed and the cultivation time dependent ORN spheroids were transferred to the 25 µM laminin-coated coverslip substrate by pipetting and differentiated for 72 hours. Before calcium imaging, coverslip substrate was combined with magnetic chamber (Live Cell instrument, Seoul, Korea) and media was replaced with KREBS ringer buffer (115 mM NaCl, 5.9 mM KCl, 2.5 mM CaCl2·2H2O, 1.2 mM MgCl2, 1.2 mM NaH2PO4, 10 mM HEPES sodium salt, 10 mM D-glucose) followed by washing with PBS. Then, cells were dyed with fluo3-AM (fluo3-AM, life technologies, Waltham, USA) according to the manufacturer's instruction. Fluorescence images of calcium indicator were monitored using a confocal microscope (Zeiss LSM 700; Carl Zeiss, Oberkochen, Germany). To stimulate ORNs, a 100 µM isovaleric acid (IVA), 2-isobutyl-3-methoxypyrazine (IBMP), citralva, and a 100 µM odorant mixture containing IVA, IBMP, and citralva were applied to the magnetic chamber by using tubing connected syringe. Intracellular calcium concentrations were calculated from the background corrected ratio of fluorescence at 506/526 nm using a two-point calibration scheme and the equation:

where R is the fluorescence ratio
Primary culture of ORNs was performed as previously described with some modifications [16]. Zero to one-day old rat pups were decapitated and olfactory epithelium (OE) was dissected and immediately placed in modified Eagle's medium containing D-valine (MDV; Welgen Inc., Worcester, USA) containing 4.8 gam/liter of HEPES buffer. The turbinates were transferred into fresh MDV to minimize contamination and centrifuged at 1000 rpm for 5 min. After the supernatant was decanted, the tissue was minced to achieve fragments of approximately 0.5 mm, resuspended in MDV, and centrifuged at 1000 rpm for 5 min. The minced tissue was then placed in 30 ml of MDV containing 1% (w/v) BSA, (SIGMA, St. Louis, USA), 1 mg/ml hyaluronidase (SIGMA), 50 µg/ml DNase (SIGMA), 2 mg/ml collagenase D (Roche Diagnostics GmbH, Mannheim, Germany), and 5 mg/ml dispase II (Roche), and incubated for 1hr at 37℃. Following incubation, cells were passed through 150 µm wire mesh and nylon mesh filters (70 µm, 40 µm and 10 µm. Small Parts, Miami, FL). After centrifugation at 1,200 rpm for 5 min, the cell pellet was resuspended in plating medium [MDV containing 10% (v/v) fetal bovine serum (FBS; GIBCO, USA), 5% (v/v) Nu-serum (BD Biosciences, Franklin Lakes, NJ, USA), 10 µM cytosine arabinoside (ara C), and 25 ng/ml nerve growth factor (NGF, Collaborative Research)]. Cultures were placed in a humidified 37℃ incubator containing 5% CO2. The cells were fed with modified Eagle's medium containing D-valine, 15% FBS, gentamicin, kanamycin, ara C (SIGMA).
Before plating dissociated ORN precursors, 96 well plates (Thermo Scientific, Waltham, USA) were coated with 100 µl of 3 µM TGPG[VGRGD(VGVPG)6]20WPC (REP) diluted in PBS and incubated for one hour in a humidified (37℃) incubator and 5% CO2. REP was prepared as previously described [17]. After one hour of incubation in the humidified incubator, REP solution was aspirated and dissociated ORN precursors suspensions (1×10⁶ cells/ml) were plated and stored in the humidified incubator. Spheroids were generated within 24 hours and fresh MEM (Welgene, Gyeongsan, Republic of Korea) containing 0.5% FBS (GE Healthcare lifesciences, Brussel, Belgium), 0.5% penicillin streptomycin (Thermo Fisher, Waltham, USA), kanamycin (SIGMA), gentamycin (SIGMA) was changed every 24 hours.
Media was aspirated and cells were washed with PBS. Cells were fixed with a 1:1 mixture of acetone and methanol. Cells were permeabilized by incubation in 0.05% Triton X-100 (Triton® X-100; SIGMA, St. Louis, USA) for ten min and blocked with 4% normal donkey serum for one hour. Cells were then incubated in a primary antibody diluted solution overnight at 4℃. Primary antibodies were anti-NST (used at 1µg/ml, abcam, Boston, USA), anti-neural cell adhesion molecule (AB5032; used at 1:100, abcam), antimicrotubule-associated protein 2 (used at 1:200, 4542, Cell signaling Technology, Danvers, USA), anti-(sex determining region Y)-box 2 (SOX2; used at 1:200, sc-17320, Santa Cruz, Dallas, USA), anti-nestin (used at 1:200, MAB353, Millipore Corp. Burlington, USA), anti-Ki-67 (used at 1:200, D3B5, Cell Signaling Technology). Incubated cells were washed three times with PBS and fluorescently labeled with secondary antibodies for 2 hours at room temperature. Secondary antibodies were donkey anti-mouse IgG H&L Alexa Fluor ®488 (ab150105; abcam), goat anti-rabbit IgG H&L Alexa Fluor ®568 (ab175471; abcam), and donkey anti-goat IgG H&L Alexa Fluor ®488 (ab150129; abcam). After washing with PBS, cells were immersed in mounting medium containing DAPI (VECTOR, Burlingame, USA) and Hoechst (Invitrogen, Carlsbad, USA) and sealed with a coverslip. Fluorescence images were obtained using a confocal microscope (Zeiss LSM 700; Carl Zeiss, Oberkochen, Germany).
For atomic force microscopy (AFM) image inspection of REP and laminin, glass coverslips were coated with REP (3 µM) and laminin (25 µg/ml). To coat REP on the coverslips, REP solution (3 µM) was poured on the coverslip and incubated for one hour in 37℃. Next, coverslips were washed three times with warmed autoclaved distilled water (37℃) and dried in a hood. To prepare laminin-coated coverslips, laminin (25 µg/ml) diluted with autoclaved distilled water was poured onto the coverslips and stored at 37℃ overnight. Coverslips were then washed three times with autoclaved distilled water and dried using a critical point dryer (EM CPD 300; Leica, Wetzlar, Germany). AFM (XE-150; Park Systems, Suwon, Republic of Korea) was operated in non-contact mode with a scanning rate of 0.5 Hz. For scanning electron microscopy (SEM), a coverslip was coated with REP (3 µM) and laminin (25 µg/ml) prepared in diluted autoclaved distilled water for an hour at 37℃. Next, coverslips were washed three times with autoclaved distilled water (37℃) and dried in a hood. To prepare laminin coated coverslips, laminin (25 µg/ml) diluted in autoclaved distilled water was poured onto the coverslip and stored at 37℃ overnight. Then, coverslips were washed three times with autoclaved distilled water and dried using the critical point dryer (EM CPD 300; Leica, Wetzlar, Germany). Before SEM inspection, coverslips were coated with Osmium in the Osmium plasma coater (Vacuum Devices Inco., Mito, Japan). SEM (Carl Zeiss, Oberkochen, Germany) was operated under chamber pressure at 6.5−6 mbar.
Single well MEA (M64-GLx; Axion bio systems, Atlanta, USA) was used in all experiments. MEA has 64 platinum black microelectrodes in an 8×8 configuration. Single electrode has 30 µm diameter with 200 µm spacing (center to center) and four ground electrodes (2 stimulation & 2 recording grounds) were equipped. Average impedance was 25 kΩ at 1 kHz and butterworth filter (0.1~3,000 Hz) setup was used. Before plating ORN precursor spheroids, MEA was sterilized three times with 95% ethanol. MEA plate wells were pretreated with 25 µM laminin prior to seeding ORN precursors. After 72 hours of ORN precursor seeding for differentiation, the media was changed to HEPES buffer. Odorants (citralva, IBMP, and IVA) were diluted in HEPES buffer to modify concentrations. In the entire experiment, odorant stimulations were performed with a 60 sec; between odorant stimulation, buffer solution was applied with 30 sec of interval. After three to five odorant stimulations, stabilization time was given for 5 min following a change to fresh media considering the desensitization of the ORNs.
Principal component analysis (PCA) was performed as follows:

where Odor represents the odorants used (ie, citralva, IBMP, IVA),

and calculated the weight vector by extracting the maximum variance from this new data matrix.

Final principal components decomposition of X can be given as,

and we generated dimension-reduction transformed data using principal component k=1 to k=3. Transformed data y was extracted from matrix T, because we only used k=1 to k=3 data and we can define data y as,

Data y can be mapped in a 3D space, so we can define distance between odorant p and odorant q as a Euclidean distance:

Distance d represents data similarity and a higher d value means less similarity.
Total RNA was obtained from ORNs and ORN spheroids using Trizol (Trizol® Reagent; Life technologies, Waltham, USA) and complementary deoxyribonucleic acid (cDNA) was synthesized by reverse transcription. Quantitative real-time RT PCR was performed using the SYBR Green PCR master mix kit (QuantiTect® SYBR® Green PCR Kit; QIAGEN, Hilden, Germany) on the Rotor-Gene Q (QIAGEN, Hilden, Germany) under the following conditions: 40~45 cycles of 95℃ for 30 sec, 60℃ for 30 sec, and 72℃ for 30 sec. Primers of the following sequences were obtained from GenoTeck (GenoTeck, Daejeon, Republic of Korea) and Bionics (Bionics, Daejeon, Republic of Korea): cyclophilin A (forward: AGC ACT GGG GAG AAA GGA TT and reverse: AGC CAC TCA GTC TTG GCA GT); MAP2 (forward: TGT TGC TGC CAA GAA AGA TG and reverse: ACG TGG CTG GAC TCA ATA CC); neuron specific enolase (NSE, forward: GTG GAC CAC ATC AAC AGC AC and reverse: TGA GCA ATG TGG CGA TAG AG); neuron-specific class III beta-tubulin (forward: TGA GGC CTC CTC TCA CAA GT and reverse: CTC ACG ACA TCC AGG ACT GA); adenylyl cyclase III (forward : TCC TGT GTT GTG CAT ACG CT and reverse: ACG TTA GCC AGG ATC TCC CT); olfactory marker protein (OMP, forward : GAA GCA GGA TGG TGS GSS GC and reverse: ATG AGG TTG GTG AGG TCG CG); neural cell adhesion molecule (NCAM, forward: AAA GGA TGG GGA ACC CAT AG and reverse: TAG GTG ATT TTG GGC TTT GC); (sex determining region Y)-box 2 (SOX2, forward: AGG GCT GGG AGA AAG AAG AG and reverse: TTG CTG ATC TCC GAG TTG TG); Ki67 (forward: GCC CAT CAC CAC AGA GAT TT and reverse: CAG TCT TCA GGG GCT CTG TC); nestin (forward: GAG GAA GCA TCG AAC TCT GG and reverse: CAG CTT TAG CTT GGG ATT GC). The house keeping gene cyclophilin A was used as an internal standard.
Calcein assay reagent (calcein red-orange, AM; Invitrogen, Carlsbad, USA) was used to evaluate call viability. ORN precursor spheroids were gently washed three times with Dulbecco's phosphate-buffered saline (DPBS; gibco® by life technologies™, Waltham, USA), treated with 3 µM calcein-AM solution and incubated at 37℃ for 30 min. Cell viability within each well was quantified by measuring optical density at 517 nm with a fluorescence reader (Gemini EM; Molecular Devices, San Jose, USA).
RESULTS
In this study, spheroid culture of the ORN precursors using REP was initially suggested. REP is an amphiphilic biosynthesized elastin-like polypeptide which modulates cellular morphology by activating cell adhesion proteins [17,18,19,20]. We have modified the dissociated neonatal rat ORN precursors based on the previously developed method [16] to study biological characteristics of ORNs and ORN-based odorant measurement [21,22,23]. In the previous results by Ronnett, dissociated rat ORN precursors were cultured on a laminin-coated plate and differentiation of ORNs was verified using immunocytochemical assays [16]. Additionally, physiological characteristics of the ORNs were verified by monitoring intracellular cAMP levels upon odorant stimulations, suggesting that the dissociated ORN precursors were appropriate for this study [24].
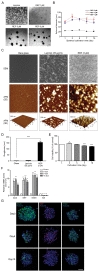
To identify optimized conditions for spheroid formation, diameters and morphology of spheroids depending on the seeding populations and REP concentrations were observed by measuring diameters of ORN spheroids. The obtained ORN precursors were plated on either REP or laminin-coated cell culture plates. ORN precursors cultured on the laminin-coated plate differentiated with neurite outgrowth, whereas, ORN precursors on the REP-coated plate aggregated and formed spheroids within 24 hours (Fig. 1A). After 24 hours of cell seeding, the average diameters of spheroids on the 1 µM REP, 3 µM REP, 5 µM REP coated plates were 24.2±0.7 µm, 62.6±2.2 µm, 56.2±2.8 µm, respectively. On day three, the average diameter of spheroids on the 3 µM REP-coated plate increased significantly to 77.5±3.3 µm and the diameter of spheroids on the 5 µM REP increased significantly to 69.4±3.6 µm on day five. ORN spheroids on both 3 µM and 5 µM REP-coated plates maintained their average diameter (60 to 70 µm) for ten days, however, the average diameter of ORN spheroids on 1 µM REP-coated plates was roughly 20 µm with poor spheroid morphology and unstable cellular aggregation (Fig. 1B). As a result, the relatively small diameter of spheroids in the 1 µM REP-coated plates might have low neuronal population after differentiation, and be limited in their ability to generate electrical signals following odorant stimulation. Therefore, 3 µM REP was used for remaining experiments.
To characterize the effect of REP on spheroid formation, surface characteristics of REP-coated coverslips was inspected using atomic force microscopy (AFM) and scanning electronic microscopy (SEM). REP formed tissue-like porous structures and attached laminin matrices formed network-like structures (Fig. 1C). Additionally, surface topography and roughness was measured by AFM. Compared to the laminin, REP formed hundreds of nanoscale height structures and had 148.3±15.9 nm roughness, which is 23.8 times higher than those grown on the laminin-coated surfaces (Fig. 1D). Therefore, disparate topographical characteristics of REP compared to laminin might affect the spheroid formation of ORN precursors plated on the REP.
Based on previous studies characterizing spheroid formation using synthetic peptides, cell-synthetic peptides and cell-cell interactions may be involved in cellular aggregation [17,20,25]. Taking previously reported results into account, VG(VGVPG)6 domains provide the hydrophobic environment enhancing cellular coupling and binding of RGD ligands to integrin on the cellular membrane to activate signal cascades which lead to the expression of cell adhesion molecules and ECM [20,25]. Together with our results, porous structures of REP with relatively high roughness may affect cellular attachment; topographical characteristics may be a factor in the formation of spheroids. Next, to assess the viability of ORN spheroids depending on the cultivation period, the calcein assay was performed. OD517nm values of dissociated ORN spheroids dyed with calcein-AM were measured using a fluorescence reader and entire OD517nm values were normalized by OD517nm values of the day one ORN spheroids. On day three, significantly increased fluorescence intensity was measured (1.05±0.03 fold), and after day three, viability gradually decreased (0.87±0.01 fold) on day ten (Fig. 1E). Decreases in the fluorescence intensity might represent a declined viability due to the environmental conditions and cell loss during media change. High viability of ORN spheroids during cultivation is necessary for the development of a cell-based biosensor bioelement; our results revealed sufficient viability for ten days.
To quantify stemness of the ORN precursor spheroids, mRNA levels of ORN stemness markers were analyzed by quantitative polymerase chain reaction (qPCR). SRY (sex determining region Y)-box 2 (SOX2), Ki67, and nestin, were used as measurement of stemness, and neuron-specific enolase (NSE) was used to verify that there was no neuronal differentiation of ORN spheroids. Normalized relative mRNA levels of SOX2, Ki67, and nestin were 8.4±0.8 folds, 8.6±0.8 folds, 11.7±1.1 folds, respectively on day three. Expression levels of these three markers were slightly increased on day five. On day ten, these levels decreased below day three values, however these differences were not statistically significant. NSE expression on days three, five, and ten were roughly 0.1 fold (Fig. 1F). For further identification of stemness of the ORN precursor spheroids, we performed immunocytochemistry (ICC) using stemness markers (ie, nestin, Ki67, and SOX2). We found that nestin was expressed on the surface of the ORN spheroids, Ki67 was co-labeled within the nucleus and SOX2 was expressed in the cell body. Those expression characteristics were not significantly different, however expression modality declined depending on the cultivation time (Fig. 1G).
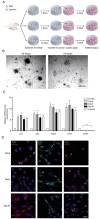
Next, we differentiated ORN spheroids and monitored their developmental characteristics using qPCR and ICC. Differentiation of ORN precursor spheroids was accomplished by transferring spheroids onto laminin-coated plates and cultivating them for 72 hours (Fig. 2A). Once the spheroids were transferred to the laminin-coated plates, the ORN precursors that formed spheroids migrated radially and displayed neurite outgrowth. (Fig. 2B).
To investigate the differentiation of ORN precursors, transcript levels of ORN developmental markers (ie,
To further examine differentiation of ORN precursor spheroids, cells were immunostained with βIII-tubulin (NST), NCAM, and MAP2 which are expressed in ORNs. Immunostaining of ORNs using antibodies against NST and NCAM proteins revealed clear expression in the neurites and soma of ORNs. In addition, MAP2 expression was observed in only one neurite of a bipolar neuron, suggesting that ORN precursors spheroids could differentiate into bipolar neurons which is the intrinsic characteristics of
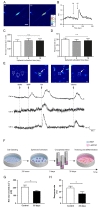
Next, we verified the physiological characteristics of ORNs using calcium imaging analysis to facilitate a comparison to
To further investigate the physiological characteristics of the ORNs, we analyzed the net-odor evoked calcium concentration and response rate based on the results of calcium imaging. Netodorant evoked calcium concentration is the absolute value of elevated calcium concentration in the odorant-stimulated ORNs and calculated using the formula described in Materials and Methods. Computed average of net odor-evoked concentrations in the ORNs cultivated for three, five, and ten days as spheroid were 195.7±24.0 nM, 205.3±24.9 nM, 205.4±22.3 nM, respectively (Fig. 3C). However, these values were not statistically significant among the three different groups. And response rate was calculated as a ratio of the number of activated cell population and whole number of cell population in a confocal microscope software window. Response rate can be used as an indicator for qualification of ORNs as a bioelement for the development of an electronic nose. Calculated response rates depending on the spheroid cultivation time (ie, three, five, and ten days) were 29.9±2.5%, 27.6±3.0%, 28.1±4.2%, respectively (Fig. 3D). Likewise, there was no significant difference among three different spheroid cultivation time groups suggesting that the physiological characteristics of the ORNs differentiated from spheroids have reliable activation rates upon odorant stimulation for up to ten days.
To understand physiological characteristics of ORNs under the single odorant stimulation, we monitored changes of intracellular calcium level of ORNs using 100 µM IBMP, 100 µM IVA, and 100 µM citralva. Fig. 3E shows a confocal microscope software window with color modification. Three cells of interest were monitored those changes in fluorescence intensity upon the odorant stimulations. Cell a was activated upon all odorant stimulations, cell b was activated by IVA, and cell c was activated by both IVA and citralva (Fig. 3E).
To extend cell storage capacity, we cryopreserved ORN spheroids for 35 days and tested physiological characteristics after thawing. ORN spheroids on day five were cryopreserved using 10% DMSO and 20% FBS solution and thawed after 35 days on the laminin-coated plate for differentiation (Fig. 3F). Compared to the day five ORN spheroid physiological characteristics, net odor-evoked calcium concentration and response rate decreased to 72.5% and 72.3%, respectively (Fig. 3G and 3H). Although the physiological level was declined by 30%, in consideration of this extended storage period, cryopreservation of primary culture ORNs showed sufficient storage capacity in view of their potential to be developed as a bioelement of a bioelectronic nose.
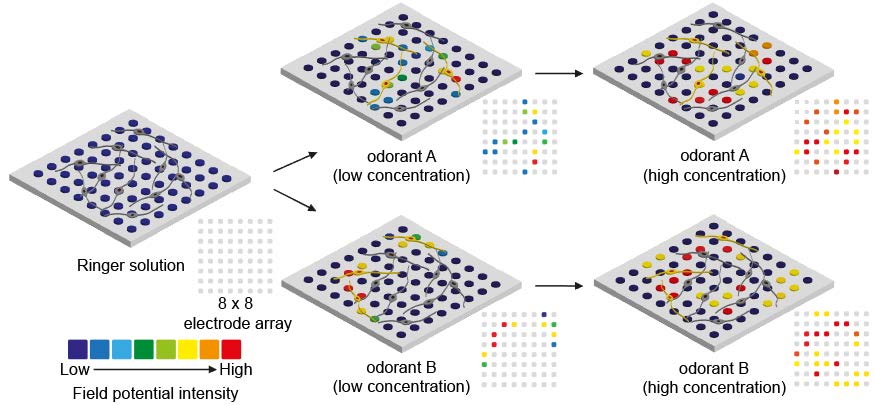
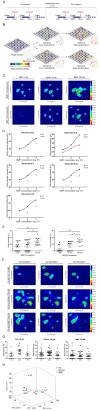
To utilize the ORN spheroid culture for developing a bioelectronic nose, we verified their capabilities to detect odorant types and concentrations by plating ORN spheroids on a commercialized MEA. ORN spheroids were differentiated onto the MEA followed by laminin coating. An illustration of experimental protocol is shown in Fig. 4A. We hypothesized that the electrical signals generated in the ORNs upon odorant stimulations and intensity of field potentials measured by MEA produced specific patterns depending on the types and concentrations of the given odorants. Therefore, analyzing the patterns of the signal from the ORNs enables the distinction of varying types and concentrations of odorants (Fig. 4B).
First, to demonstrate whether odorant concentrations can be detected using the ORN spheroids plated MEA, ORNs were stimulated by 1 µM, 10 µM, and 100 µM IBMP for two times and generated field potentials were measured. Measured field potentials were illustrated for displaying concentration dependent similarity of signal patterns. In the 1 µM IBMP stimulation, measured field potentials occurred primarily at the following electrodes [electrode position (x,y): (2,4), (4,4), (4,7), (5,2), (7,5)] with the following values (29.9 µV, 25.8 µV, 30 µV, 29.8 µV, 29.8 µV, respectively). And in the 100 µM IBMP stimulation, field potentials measured at the same electrodes were 23.8 µV, 58.5 µV, 37 µV, 37.1 µV, 37.3 µV, respectively (Fig. 4C). Waveforms of field potentials are shown in Supplementary Fig. 1. In the second session, field potentials were measured at similar position of electrodes. Interestingly, at electrode number (4,4), the biggest intensity of field potentials was measured like first session, and at other electrode positions monitored in the first session also measured increased field potentials depending on the IBMP concentration. And based on the results, dose-response curves of field potentials at five electrode positions were constructed depending on the IBMP concentration (Fig. 4D) and these shape of curve were similar to ligand-olfactory receptor interactions reported in many studies [29,30,31]. Additionally, we found significant increase of averages of field potentials in both sessions and the average intensities in first and second sessions were 12.02±2.92 µV in 1 µM IBMP, 14.52±3.42 µV in 10 µM IBMP, 27.89±2.59 µV in 100 µM IBMP and 5.17±2.75 µV in 1 µM IBMP, 14.64±3.78 µV in 10 µM IBMP, 27.66±2.87 µV in 100 µM IBMP, respectively (Fig. 4E). The correlation coefficient of the first and second patterns were 0.57 at 1 µM, 0.75 at 10 µM, and 0.84 at 100 µM. As a result, average field potential in the second session decreased by 30% compared to the first session. However, an increase in field potential depending on IBMP concentration was still observed, suggesting that different concentrations of odorant measurement using the ORN-based biosensor can be performed with reproducibility by analyzing signal patterns.
Next, to test capabilities of odorant discrimination, 100 µM IBMP, 100 µM citralva, and 100 µM IVA were used to stimulate ORNs. Using another setup of MEA which different distribution of ORNs were plated, patterns of field potentials depending on types of odorants were observed upon three times of odorant stimulations. In the first stimulation of 100 µM IVA, the highest field potential intensity was measured at electrode position (3,5). During three times of IVA stimulations, similar patterns of field potentials were produced (Fig. 4F). In the second odorant stimulation of 100 µM citralva, considerably different patterns of field potentials were produced and population of the responded ORNs were increased by 2.5 times compared to those of in the IVA stimulation. Likewise, in the IBMP stimulation, different patterns of field potentials were observed with different position of electrodes. Waveform data are shown in Supplementary Fig. 2. Average intensity of field potentials through three odorant stimulations showed odorant dependent characteristics. Following three odorant stimulations with IVA, 25.57±6.04 µV, 43.53±4.81 µV, and 30.25±5.55 µV field potentials were measured. Following stimulation with citralva, 39.67±4.54 µV, 43.25±4.06 µV, and 34.84±3.50 µV field potentials were measured. These two odorants showed increased and decreased field potentials in the second and third stimulations. However, IBMP showed a gradually decreasing field potential in the three times of stimulations (Fig. 4G). Based on the changes of average field potential in the three odorant stimulations, odorant dependent modality of desensitization was found. Next, discrimination of measured patterns of field potentials were verified by performing PCA (Fig. 4H). PCA results showed that patterns collected from the same odorant had similar component values, meaning that the developed ORN-based biosensor had capability of discriminating IVA, citralva, and IBMP.
All waveforms measured in entire MEA experiments were classified into three types depending on polarity and order of peaks. First type of waveform (Supplementary Fig. 3) has only positive peak which is known as representative recorded signals from olfactory supporting cells [32]. Second type of waveform (Supplementary Fig. 3) has first negative peak and following positive peak which is usually measured waveforms near somatic ORNs [33]. And third type of waveform (Supplementary Fig. 3) has first positive peak and following negative peak which is reported as a representative dendritic ORN waveform. In conclusion, we found that both dendritic and somatic ORN type of waveforms were contributed to the activation by odorants, however supporting cell type of waveforms were not affected to the generation of meaningful signals because supporting cells do not express ORs, thus there were no interactions with odorants. Therefore, based on the classified three type of waveforms, we calculated that 46.7% was dendritic ORN type, 32% was somatic type, and 21.3% was ORN supporting cell type in the entire waveforms. And we can predict that efficiency of field potential measurement (78.7%) from the ratio of dendritic and somatic ORN type of waveforms and supporting cell type of waveforms.
DISCUSSION
In this study, we developed an ORN precursor spheroid culture technique and obtained stable spheroid culture conditions using REP. Stable and reproducible formation of ORN precursor spheroids were realized by using REP and their viability and stemness remained for ten days–greater than what is currently possible with previous monolayer ORN primary culture approaches. In addition, differentiation of ORN spheroids on laminin was verified by qPCR and ICC assays. Intracellular calcium levels (a marker of physiological characteristics) of ORNs differentiated from the spheroids were analyzed following odorant stimulation; these physiological conditions were also maintained for ten days of spheroid cultivation. Moreover, we observed an odorant-dependent calcium response lasting for 35 days upon odorant stimulation in the differentiated ORNs from the cryopreserved ORN spheroids. For application of the ORN spheroid culture to a bioelectronics nose, ORN precursor spheroids were coupled with MEA and electrical signals measured following odorant stimulation. ORNs on the MEA successfully measured and discriminated concentrations and types of odorants with high accuracy and reproducibility.
Compared to the conventional primary ORN culture method [16], ORN spheroid culture has comprehensive experimental convenience as summarized in Table 1. First,
Based on the results of electrical signal measurement of ORNs using MEA, we observed distinct electrical signal patterns depending on the type of odorant. The electrical signal patterns were composed of electrical potentials at a single electrode. We have assumed that measured field potential at a single electrode is a sum of generated extracellular electrical signals of ORNs near the electrode. Each ORNs express their own ORs which have specific affinity to particular odor molecules. Binding affinity of the odor molecule to an OR affects intracellular cAMP levels and the increased cAMP levels open cyclic nucleotide-gated (CNG) channels causing sodium and calcium ions influx. The increased intracellular calcium ions open calcium-dependent chloride channels and activation of chloride channels depolarize the cell membrane. In summary, the detected field potential at an electrode upon an odorant stimulation is the result of depolarized membrane of an ORN and amplitude of field potential is determined by the expressed ORs in ORNs near an electrode. Above all, electrical signal patterns produced by odorant stimulation were reproducible and reliable on the ORN-coupled MEA during repetitive odorant stimulations, suggesting that development of a promising ORN-based biosensor for detecting and discriminating odorants can be realizable using ORN precursor spheroids as a bioelement.
Developed cell-based biosensors use a commercially available MEA which can be easily conjugated with ORNs on entire MEA substrate. Electrical signals measured at all electrodes provide insight into the position and intensity, and this information can be analyzed to identify a given odorant and its concentrations. Odorant identification mechanisms of the developed ORN-based biosensor is similar to encoding systems of the mammalian olfactory system. Cultured rat ORNs have roughly 1,000 OR genes and axons of ORNs expressing the same OR gene project to the same glomeruli in the OB where the encoding process first occurs [5,6,7]. Likewise, in the developed ORN-based biosensor, many rat ORNs were spread on the MEA substrate and ORNs around 64 electrodes generate electrical signals following odorant stimulation. Here, electrodes that are acting as a glomerulus produce specific signal patterns depending on the type and concentration of an odorant. This odorant detection method which mimics the mammalian odorant encoding process can analyze many odorants and their concentrations compared to previous biosensors which are limited in the number of detectable odorants.
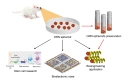
The developed ORN spheroid culture can be a useful tool in a variety of applications (eg, biological studies and bioengineering). Additionally, measuring stemness, differentiation, and OR expression depending on various environmental conditions can be tested using the ORN spheroid culture. Implantation of ORN spheroids into animals for olfactory regeneration might also be considered. Based on the results, development of high-throughput odorant screening system and olfactory mimetic biosensor with high performance using various electrical signal measuring materials are feasible. Lastly, the developed ORN culture method may be also used for the bioengineering application such as the cell carrying micro robot [35] (Fig. 5).
SUPPLEMENTARY MATERIALS
Supplementary Fig. 1
Waveform of measured field potential. (A) Waveforms of field potential upon IBMP(1 µM, 10 µM, 100 µM) stimulation in the first session. (B) Waveforms of field potential upon IBMP(1 µM, 10 µM, 100 µM) stimulation in the second session.
en-27-574-s001.pdfSupplementary Fig. 2
Waveform of measured field potential. (A) Waveforms of field potential upon three times of 100µM IVA stimulation. (B) Waveforms of field potential upon three times of 100µM citralva stimulation. (C) Waveforms of field potential upon three times of 100µM IBMP stimulation.
en-27-574-s002.pdfSupplementary Fig. 3
Classification of waforms measured in the MEA. (a) Representative waveforms measured near supporting cells, (b) representative waveforms measured near somatic area of ORNs, and (c) representative waveforms measured near dendritic area of ORNs.
en-27-574-s003.pdfFigures
Tables
| Conventional ORN primary culture | ORN spheroid culture using REP | |
|---|---|---|
| Available period of cultured cells | ~ 7 days | ~ 40 days (including cryopreservation period) |
| Long-term storage | Impossible | Possible |
| Homogeneity of cell developmental state | Low | High |
References
- Masaoka Y, Harding IH, Koiwa N, Yoshida M, Harrison BJ, Lorenzetti V, Ida M, Izumizaki M, Pantelis C, Homma I. The neural cascade of olfactory processing: a combined fMRI-EEG study. Respir Physiol Neurobiol 2014;204:71-77.

- Shepherd GM. Discrimination of molecular signals by the olfactory receptor neuron. Neuron 1994;13:771-790.
- Duchamp-Viret P, Chaput MA, Duchamp A. Odor response properties of rat olfactory receptor neurons. Science 1999;284:2171-2174.
- Ronnett GV, Moon C. G proteins and olfactory signal transduction. Annu Rev Physiol 2002;64:189-222.
- Touhara K. Odor discrimination by G protein-coupled olfactory receptors. Microsc Res Tech 2002;58:135-141.
- Nara K, Saraiva LR, Ye X, Buck LB. A large-scale analysis of odor coding in the olfactory epithelium. J Neurosci 2011;31:9179-9191.
- Fleischer J, Breer H, Strotmann J. Mammalian olfactory receptors. Front Cell Neurosci 2009;3:9.
- Young JM, Trask BJ. The sense of smell: genomics of vertebrate odorant receptors. Hum Mol Genet 2002;11:1153-1160.
- Du L, Wu C, Peng H, Zhao L, Huang L, Wang P. Bioengineered olfactory sensory neuron-based biosensor for specific odorant detection. Biosens Bioelectron 2013;40:401-406.
- Mitsuno H, Sakurai T, Namiki S, Mitsuhashi H, Kanzaki R. Novel cell-based odorant sensor elements based on insect odorant receptors. Biosens Bioelectron 2015;65:287-294.
- Goldsmith BR, Mitala JJ, Josue J, Castro A, Lerner MB, Bayburt TH, Khamis SM, Jones RA, Brand JG, Sligar SG, Luetje CW, Gelperin A, Rhodes PA, Discher BM, Johnson AT. Biomimetic chemical sensors using nanoelectronic readout of olfactory receptor proteins. ACS Nano 2011;5:5408-5416.
- Oh EH, Lee SH, Lee SH, Ko HJ, Park TH. Cell-based high-throughput odorant screening system through visualization on a microwell array. Biosens Bioelectron 2014;53:18-25.
- Covington JA, Gardner JW, Hamilton A, Pearce TC, Tan SL. Towards a truly biomimetic olfactory microsystem: an artificial olfactory mucosa. IET Nanobiotechnol 2007;1:15-21.
- Jensen JB, Parmar M. Strengths and limitations of the neurosphere culture system. Mol Neurobiol 2006;34:153-161.
- Fennema E, Rivron N, Rouwkema J, van Blitterswijk C, de Boer J. Spheroid culture as a tool for creating 3D complex tissues. Trends Biotechnol 2013;31:108-115.
- Ronnett GV, Hester LD, Snyder SH. Primary culture of neonatal rat olfactory neurons. J Neurosci 1991;11:1243-1255.
- Jeon WB, Park BH, Wei J, Park RW. Stimulation of fibroblasts and neuroblasts on a biomimetic extracellular matrix consisting of tandem repeats of the elastic VGVPG domain and RGD motif. J Biomed Mater Res A 2011;97:152-157.
- Jung GS, Lee KM, Park JK, Choi SK, Jeon WB. Morphogenetic and neuronal characterization of human neuroblastoma multicellular spheroids cultured under undifferentiated and all-trans-retinoic acid-differentiated conditions. BMB Rep 2013;46:276-281.
- Kearns SM, Laywell ED, Kukekov VK, Steindler DA. Extracellular matrix effects on neurosphere cell motility. Exp Neurol 2003;182:240-244.
- Lee KM, Jung GS, Park JK, Choi SK, Jeon WB. Effects of Arg-Gly-Asp-modified elastin-like polypeptide on pseudoislet formation via up-regulation of cell adhesion molecules and extracellular matrix proteins. Acta Biomater 2013;9:5600-5608.
- Kim SY, Mammen A, Yoo SJ, Cho B, Kim EK, Park JI, Moon C, Ronnett GV. Phosphoinositide and Erk signaling pathways mediate activity-driven rodent olfactory sensory neuronal survival and stress mitigation. J Neurochem 2015;134:486-498.
- Kim SY, Yoo SJ, Ronnett GV, Kim EK, Moon C. Odorant stimulation promotes survival of rodent olfactory receptor neurons via PI3K/Akt activation and Bcl-2 expression. Mol Cells 2015;38:535-539.
- Kim H, Kim SY, Nam S, Ronnett GV, Han HS, Moon C, Kim Y. Direct measurement of extracellular electrical signals from mammalian olfactory sensory neurons in planar triode devices. Analyst (Lond) 2012;137:2047-2053.
- Ronnett GV, Parfitt DJ, Hester LD, Snyder SH. Odorant-sensitive adenylate cyclase: rapid, potent activation and desensitization in primary olfactory neuronal cultures. Proc Natl Acad Sci U S A 1991;88:2366-2369.
- Salmenperä P, Kankuri E, Bizik J, Sirén V, Virtanen I, Takahashi S, Leiss M, Fässler R, Vaheri A. Formation and activation of fibroblast spheroids depend on fibronectin-integrin interaction. Exp Cell Res 2008;314:3444-3452.
- Lee AC, He J, Ma M. Olfactory marker protein is critical for functional maturation of olfactory sensory neurons and development of mother preference. J Neurosci 2011;31:2974-2982.
- Cao L, Rickenbacher GT, Rodriguez S, Moulia TW, Albers MW. The precision of axon targeting of mouse olfactory sensory neurons requires the BACE1 protease. Sci Rep 2012;2:231.
- Yamagishi M, Nakamura H, Takahashi S, Nakano Y, Iwanaga T. Olfactory receptor cells: immunocytochemistry for nervous system-specific proteins and re-evaluation of their precursor cells. Arch Histol Cytol 1989;52:375-381.
- Mainland JD, Keller A, Li YR, Zhou T, Trimmer C, Snyder LL, Moberly AH, Adipietro KA, Liu WL, Zhuang H, Zhan S, Lee SS, Lin A, Matsunami H. The missense of smell: functional variability in the human odorant receptor repertoire. Nat Neurosci 2014;17:114-120.
- Yu Y, de March CA, Ni MJ, Adipietro KA, Golebiowski J, Matsunami H, Ma M. Responsiveness of G proteincoupled odorant receptors is partially attributed to the activation mechanism. Proc Natl Acad Sci U S A 2015;112:14966-14971.
- Mainland JD, Li YR, Zhou T, Liu WL, Matsunami H. Human olfactory receptor responses to odorants. Sci Data 2015;2:150002.
- Trotier D, MacLeod P. Intracellular recordings from salamander olfactory supporting cells. Brain Res 1986;374:205-211.
- Getchell TV. Functional properties of vertebrate olfactory receptor neurons. Physiol Rev 1986;66:772-818.
- Krolewski RC, Jang W, Schwob JE. The generation of olfactory epithelial neurospheres in vitro predicts engraftment capacity following transplantation in vivo. Exp Neurol 2011;229:308-323.
- Lee S, Kim S, Kim S, Kim JY, Moon C, Nelson BJ, Choi H. A capsule-type microrobot with pick-and-drop motion for targeted drug and cell delivery. Adv Healthc Mater 2018;7:e1700985.