Articles

Article Tools
 View Full Text View Full Text |
 Abstract Abstract |
 Article as PDF Article as PDF |
 Print this Article Print this Article |
 Pubmed Pubmed |
 PMC PMC |
 PubReader PubReader |
 Export to Citation Export to Citation |
 Email Alerts Email Alerts |
 Open Access Open Access |
Share this article on :


Stats or Metrics
Article
Original Article
Exp Neurobiol 2019; 28(3): 436-445
Published online June 26, 2019
https://doi.org/10.5607/en.2019.28.3.436
© The Korean Society for Brain and Neural Sciences
FxClear, A Free-hydrogel Electrophoretic Tissue Clearing Method for Rapid De-lipidation of Tissues with High Preservation of Immunoreactivity
Jungyoon Choi†, Eunsoo Lee†, June Hoan Kim, and Woong Sun*
Department of Anatomy and Division of Brain Korea 21 Plus Program for Biomedical Science, Korea University College of Medicine, Seoul 02841, Korea.
Correspondence to: *To whom correspondence should be addressed.
TEL: 82-2-2286-1404, FAX: 82-2-929-5696
e-mail: woongsun@korea.ac.kr
†Two authors contributed equally to this study
Abstract
Over the last two decades, several tissue clearing methodologies have been established that render tissues optically transparent and allow imaging of unsectioned tissues of significant volumes, thus improving the capacity to study the relationships between cell and 3D tissue architecture. Despite these technical advances, the important unsolved challenges that these methods face include complexity, time, consistency of tissue size before and after clearing, and ability to immunolabel various antibodies in cleared tissue. Here, we established very simple and fast tissue clearing protocol, FxClear, which involves acrylamide-free electrophoretic tissue clearing (ETC). By removal of the acrylamide infusion step, we were able to achieve fast reaction time, smaller tissue expansion, and higher immunoreactivity. Especially, immunoreactivity and fluorescence intensity were increased in FxClear-processed tissues compared to un-cleared tissues. Our protocol may be suitable for small-sized biopsy samples for 3D pathological examinations.
Graphical Abstract
Keywords: Three dimensional imaging, Immunohistochemistry, Tissue engineering, Brain tissue
INTRODUCTION
Tissue clearing technology for optical examination of the 3-dimensional (3D) structure and protein distribution has been developed and applied for histological and pathological examinations [1,2,3,4,5,6,7,8,9,10]. Transparency of tissue is achieved by a combination of multiple factors including de-lipidation and adjustment of the refractive index (RI) [11], and all tissue clearing protocols are established based on the optimization of these factors [12,13,14,15,16,17,18,19,20,21]. Since different tissues have different optical properties owing to the varying contribution of the aforementioned factors, a plethora of tissue clearing techniques have been proposed [2,3,4,9,14,15,16,17,18,19,20,21,22]. Although RI matching is sufficient for clearing small and soft samples, it is often insufficient to clear large and hard tissue containing a high proportion of lipids or extracellular matrix proteins [11,23]. Because lipids are one of the main molecules that increase light scattering, de-lipidation is one of the major contributors of optical clearing, and several methods employ de-lipidation steps with organic solvents that can maintain immunoreactivity and/or fluorescent signals from GFP-derivative proteins. Several versions of CUBIC and iDISCO methods are examples of this tissue clearing category [14,16,18]. Alternatively, lipids can be removed with detergents such as sodium dodecyl sulfate (SDS), which is preferred in many protocols, especially with hydrogel-embedded protocols such as CLARITY, PACT, and ACT [3,9,15]. One advantage of SDS as a de-lipidation reagent is that it can be combined with electrophoretic clearing because SDS is an anion that can be actively transported deep inside the tissues to speed up the clearing process [3,9,24]. Accordingly, we have previously demonstrated an improved method involving an electrophoretic device in combination with loose acrylamide crosslinking which can expedite the tissue clearing process up to 30-fold when compared with the simple diffusion-based clearing protocols [9].
Hydrogel embedding is not essential for de-lipidation, and several protocols, such as SWITCH and FASTClear, utilize SDS for de-lipidation without hydrogel embedding [25,26]. Formation of a hydrogel-tissue complex provides durable physical strength for a robust de-lipidation process, and it also provides unique add-on features such as expandability, dry-ability, and selective ability to conjugate with functional chemicals [27]. In contrast, hydrogel embedding has several drawbacks for tissue clearing. First, the hyper-hydrophilic nature of acrylamide expands tissue during the clearing procedure; often this property is not desirable for the maintenance of sophisticated subcellular structures [7]. In addition, crosslinking of acrylamide to proteins increases the risk of losing immunoreactivity [7,14]. Finally, the inclusion of a step for the infiltration of acrylamide monomers into the tissues increases the complexity of the protocol and is often undesirable in scenarios where the perfusion of acrylamide solution is not applicable [12,28].
Recently, the FASTClear protocol was proposed for cardiac tissue, which provided proof-of-concept that acrylamide is not essential for tissue clearing. However, the characteristics of FASTClear-based tissue clearing was not comprehensively examined in soft tissues such as brain. Here, we demonstrated that ETC can be combined with an acrylamide-free tissue clearing protocol and named it FxClear (Fix-Clear). By removal of the acrylamide infusion step, we were able to achieve shorter reaction times, smaller tissue expansion, and higher immunoreactivity. In addition, by utilizing an electrophoretic mechanism with SDS for de-lipidation, we were able to clear the specimen rapidly. Our protocol is especially suitable for small-sized samples for 3D pathological examination of the specimen.
MATERIALS AND METHODS
C57BL/6 male and pregnant female (TP12.5) mice were purchased from KOATECH, Inc. Thy1-eYFP, Tau-GFP (Jackson Laboratory) transgenic mice were used in this study. Pregnant Sprague-Dawley rats (TP18.5) were purchased from Orient-Bio, Inc. All animal care and euthanasia protocols were in accordance with guidelines from Korea University and have been approved by members of the Korea University Institutional Animal Care and Use Committee (KUIACUC-20150520-1).
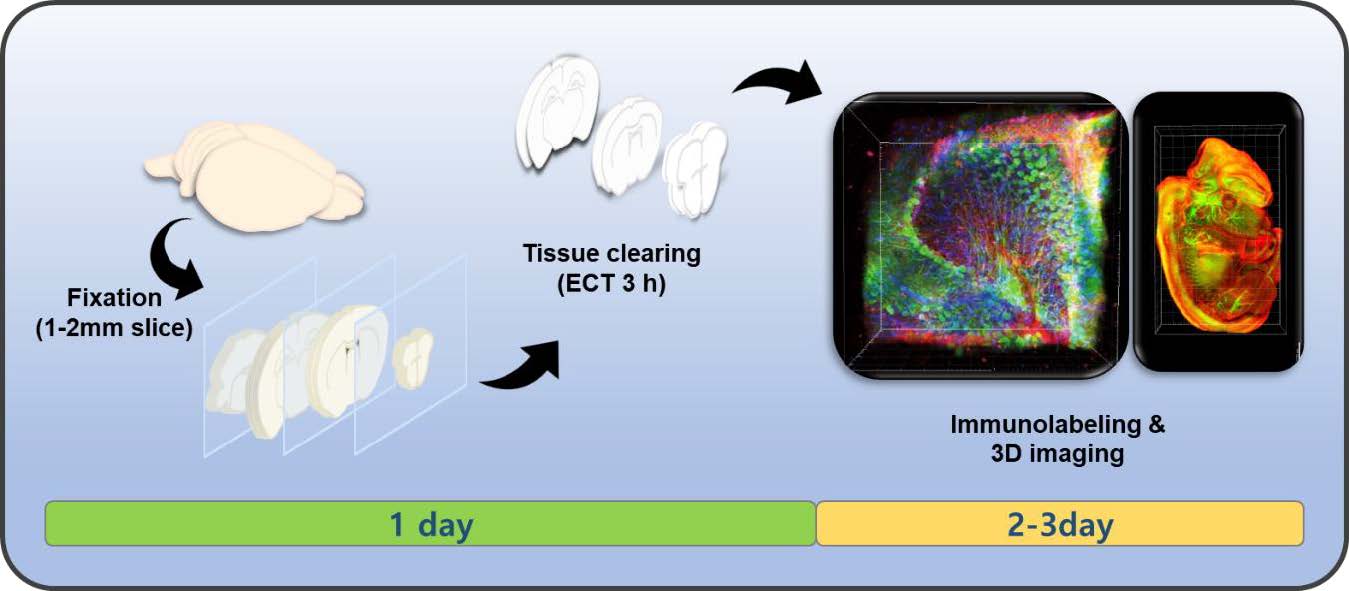
Male mice (8-weeks-old) were anesthetized with ketamine (30 mg/kg) and xylazine (10 mg/kg). Then, mice were transcardially perfused with 100 ml 1× Phosphate Buffered Saline (PBS) followed by 70 ml 4% paraformaldehyde (PFA) in 1× PBS. Organs from mice were post-fixed in 4% PFA overnight at 4℃. Before electrophoretic tissue clearing, fixed samples were washed with 0.1× PBS several times. Samples were transferred into the cassette for the electrophoretic tissue clearing (ETC) chamber (X-CLARITY, Logos Biosystems, Republic of Korea) and the cassette was placed into the chamber containing 2% SDS and 200 mM boric acid in H2O (pH 8.5). ETC was processed with following conditions: 1.2 A, 37℃, time depending on the sample thickness (3 h for 1-mm brain slice, 12 h for 2~3mm brain slices, 28 h for whole mouse brain, 12 h for whole mouse embryo, 18 h for whole mouse kidney, 37 h for whole mouse liver and 18 h for mouse liver slices, otherwise mentioned). After tissue clearing, all samples were washed in 0.1× PBS overnight at room temperature while shaking to remove SDS.
Comparison with other clearing methods was performed by following the protocols described in the original published papers [9,26]. For ACT, 8-week-old C57BL/6 mice (KOATECH, Inc, Republic of Korea) were perfusion-fixed with PFA, and the fixed brain was further incubated in hydrogel solution overnight at 4 ℃. Hydrogel-infused brain was polymerized for 2~3 h after degassing. Polymerized brain was cut into 1-mm-thick slices and electrophoresed for fast removal of lipids, using an ETC apparatus with following conditions: 1.5 A, 37 ℃ and 1 h. For FASTClear, fixed mouse slices (1-mm) were incubated in 4% SDS buffer for 12 h at 50 ℃ oven to achieve de-lipidation of the tissue.
Tissue transparency measurement was executed using an adapted protocol previously described [9,29]. Briefly, the brain slices were imaged using a conventional camera before and after clearing. We measured the size and transparency of the cleared 1-mm-thick brain slices, which were outlined and calculated using ImageJ (NIH, USA). The gray value of the cleared sample image was used to measure tissue transparency, and transparency was normalized to the background part of the image. For τ measurements, transparency was acquired by fitting with the one-phase association function.
Oil-Red-O (ORO, O0625, Sigma-Aldrich, USA) was used to measure the amount of lipid droplets in a tissue, as we previously reported [11]. Samples were immersed in ORO (2 mM in 100% isopropanol, 10 µl/mg) and incubated at room temperature for 2 h. ORO-stained tissues were washed in 1% SDS overnight and lipids were extracted by soaking in 100% isopropanol for 4 h, then the extracted fluorescence was measured with a Micro plate reader (SpectraMax Plus384, Molecular Devices, Sunnyvale, CA, USA) at 500 nm.
DiI (468495, Sigma-Aldrich, USA) was used to measure the amount of phospholipids in a tissue. The tissue was immersed in 100% dimethyl sulfoxide (DMSO) for 24 h to allow homogenous loading of DiI deep into the tissue, after which it was again immersed in 0.2 mM DiI in DMSO overnight. Then, the tissue was washed with 1% SDS overnight, followed by the extraction of lipids by soaking in 100% isopropanol for 4 h. The extracted fluorescence was measured using a Micro plate reader (SpectraMax Plus384, Molecular Devices, Sunnyvale, CA, USA) at 550 nm.
Time constant (τ) measurement was achieved using an adapted protocol described previously [11]. Briefly, the glass bottom of a 35-mm-diameter black confocal dish (102350, SPL, Republic of Korea) was covered with a thin polydimethylsiloxane (PDMS) sheet, onto which a tissue stored in PBS was pinned using a short thin tungsten wire to prevent it from moving when the solution was exchanged. The dish was mounted onto the stage of a microscope (EVOS FL, Thermo Fisher Scientific) and filled with PBS, and a reference image was acquired. The RI-matching solution was added to the dish right after the PBS was removed, and time-lapse images were acquired for 1 h with 10-sec interval. The changes in intensity with time for each image was fitted to a onephase association function (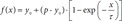
The percentage of protein loss was obtained by measuring the amount of total protein in the clearing solutions collected from all groups. Protein content was assessed with a Micro plate reader (SpectraMax Plus384, Molecular Devices, Sunnyvale, CA, USA) blanked with the respective solutions and normalized to the weight of the slices before clearing.
Thy1-YFP mice were used for fluorescence intensity measurements. Fluorescent images were captured with a TCS SP8 confocal laser-scanning microscope with a 25× lens, 488-nm excitation wavelength and the same imaging parameters for all groups. Obtained images were converted to 8-bit gray scale (fluorescence intensity from 0~255) using ImageJ, and the mean intensity in the region was calculated from thresholded pixels excluding background fluorescence.
For fluorescence quantification of immunolabeled 1 mm-thick brain slices, the z-stack fluorescence images of tissues were acquired with a TCS SP8 confocal laser-scanning microscope with a 25× lens, 488 and 568-nm excitation wavelength and the same imaging parameters for the three groups. Images were acquired at the surface of brain slices (n=7) and converted to 8-bit gray scale (fluorescence intensity from 0~255), then the total number of pixels and the number of pixels found in each gray value were calculated. Finally, we calculated the highest gray value as the ‘intensity 100’ and showed a histogram of the distribution of gray values in the whole image.
To calculate the signal-to-noise ratio (SNR) for each image, intensity profiles of single images were obtained with ImageJ. SNR was calculated using mean/standard deviation in a uniform region with this formula ‘SNR=20*log ((intensity signal)/(intensity noise))’.
Tissues were washed with 0.1× PBS several times at room temperature with gentle shaking, and incubated with the primary antibodies in 6% (w/v) bovine serum albumin (BSA), 0.2% (v/v) Triton X-100, 0.01% (w/v) sodium azide in 0.1× PBS for 1~2 days in a 37℃ shaker. Antibodies against Calbindin (1:500, AB1778, Millipore), Collagen type IV (1:500, AB769, Millipore), DCX (1:500, SC-8066, Santa Cruz), GFAP (1:500, z0334, DAKO), GFP (1:1000, ab13970, Abcam), Iba1 (1:500, 019-19741, WACO), Laminin (1:500, L9393, Sigma) and TH (1:1000, AB152, Millipore) were used. Samples were washed several times with 0.1× PBS and incubated with secondary antibodies (1:500) for 1~2 days in a 37℃ shaker that matched the host of each primary antibody for fluorescence imaging. Samples were incubated in CUBIC-mouse solution [9] for at least 1 h. Images were acquired using a TCS SP8 confocal laser-scanning microscope (Leica, Germany). Image reconstructions were performed using LAS X software (Leica) or Imaris imaging software (Bitplane). After imaging, samples were stored in PBS at 4℃.
Data were analyzed with Graphpad Prism software, and results were presented as mean±SEM. Comparisons were performed using unpaired two-tailed Student's t-test and one-way ANOVA followed by Bonferroni post-test when appropriate. A p-value of < 0.05 was considered statistically significant.
RESULTS
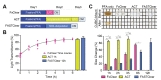
The brief workflows for ACT, FASTClear, and FxClear are summarized in Fig. 1A. Because ACT includes a step for acrylamide monomer infusion and polymerization, the total duration for the 1-mm brain slice processing was 3 working days when the fixation step is included. FASTClear also requires 3 days since it needs longer time for passive de-lipidation. On the other hand, FxClear can be done within 2 days owing to active de-lipidation with the electrophoretic tissue clearing (ETC) device (Fig. 1A). We measured the effect of different durations of ETC on the transparency of the 1-mm brain slice with the FxClear protocol. A relatively short ETC processing time (3 h) was sufficient for achieving adequate (>90%) transparency before RI adjustment with CUBIC-Mount (CM), which was equivalent to the 1 h ATC and 12 h FASTClear samples (Fig. 1B).
The expansion of tissues during the ACT process a typical occurrence [9]. Comparing to the ACT which caused a 2-fold increase in the tissue size after 1~3 h of ETC, FxClear only caused 40% and 80% expansion of tissue size from 3 h and 6 h of ETC, respectively (Fig. 1C). This degree of tissue expansion was also seen in 12 h FASTClear, suggesting that ETC expedites the de-lipidation process and tissue expansion 2~4 times faster than the passive protocol. In all protocols, processed tissues returned to their original size after the PBS washes and subsequent RI adjustment with the CUBIC-mount solution (data not shown).
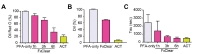
De-lipidation is required for both tissue clarity enhancement and antibody penetration for deep imaging [9,11]. Thus, to directly assess the efficiency of de-lipidation in FxClear protocol, we measured the rate of lipid removal using two different methods which favorably measure oil droplets (Oil red-O, Fig. 2A) and lipid membranes (DiI, Fig. 2B). Interestingly, de-lipidation was not sufficient and only 20% and 70% of lipid removal was achieved by 3 h and 6 h ETC. On the other hand, the ACT procedure can efficiently remove lipids with 1 h ETC. These data suggest that the acrylamide-protein complex may alter tissue chemistry favoring the SDS-based removal of lipid species. Because the contribution of RI adjustment in the tissue-clearing is relatively high in brain tissues [11], 1~3 h of ETC with FxClear technique was sufficient to achieve 95% transparency even when lipids were not completely removed.
The diffusions of the RI solutions (tau value) are affected by multiple factors including tissue porosity, lipid contents, and the micro-architecture of the tissues. Previously, we proposed that tau measurement is an efficient method to rapidly assess the quality of the cleared tissues [11], thus we compared the tau values in several specimens processed with FxClear or ACT protocols. Interestingly, the tau value of 3 h ETC samples was similar to that of 1 h ACT samples, which is consistent with the minimal ETC time of the FxClear protocol required to achieve tissue transparency (Fig. 2C).
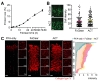
During the ACT process, proteins are fixed with PFA and conjugated with polyacrylamide hydrogel, making proteins difficult to be removed. On the other hand, since FxClear does not include acrylamide polymerization, we wanted to examine whether proteins were appropriately preserved during the ETC step of the FxClear protocol (Fig. 3A). Quantification of protein loss during ETC revealed two different phases of protein extraction. In an early phase (0~12 h of ETC), proteins were slowly extracted from the tissue and less than 2% of total proteins were lost. On the other hand, protein removal was significantly accelerated in a later phase (12~72 h of ETC), and the loss of proteins reached >15% by 72 h ETC. Although the underlying cause of the second phase of protein extraction is unclear, FxClear with a 12 h ETC period appears to be safe with >98% of total protein preservation. Accordingly, GFP signals remaining in the 3 h FxClear-processed Thy1-YFP mouse brain slice samples were indistinguishable with samples processed with 1 h ACT (Fig. 3B). Furthermore, similar quality of deep imaging with antibody labeling was achieved with FxClear and ACT-processed samples (Fig. 3C).
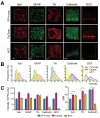
Previously, we reported that acrylamide-protein conjugation reduced the immunoreactivity of several antibodies, and about 10% of antibodies which produced reliable signals in PFA-fixed conventional sections failed to exhibit significant signals in ACT samples [9]. Because FxClear does not include acrylamide, we next tested whether FxClear can save immunoreactivities better (Fig. 4A). We randomly chose 5 antibodies (Iba1, GFAP, Tyrosinehydroxylase (TH), Calbindin, DCX), and found that all their immunoreactivities in FxClear tissues were superior to those in ACT tissues. Importantly, two antibodies (Calbindin and DCX) which failed to exhibit significant immunoreactivity with ACT samples showed clear and noticeable immunoreactivity with FxClear 3 h processed samples. Furthermore, the intensities of immunoreactivities in FxClear samples were even greater (10~50% depending on the antibodies) than in conventional PFA-only, thin-sectioned samples (Fig. 4B and 4C,
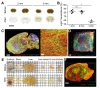
So far, we have tested the feasibility of the FxClear protocol with 1-mm-thick brain slices. Finally, we tested whether thicker brain slices or other peripheral organs can be cleared and imaged. Since we found that an ETC longer than 12 h may cause unwanted protein loss, we fixed the ETC time at 12 h and tested the transparency with 2- or 3-mm thick brain slices (Fig. 5A). As a result, 2-mm brain slices reached to >80% transparency in 12 h ETC, while 3-mm slices achieved <60% transparency (Fig. 5B). However, we were able to visualize blood vessels, astrocytes (GFAP-positive) and Purkinje cell (Calbindin-positive) in adult mouse brain by immunostaining with collagen Type IV, GFAP and Calbindin antibodies in 2~3 mm-thick FxClear processed tissue (Fig. 5C and 5D).
In the case when we increased the ETC time to >12 h, whole organs or embryos could be cleared (Fig. 5E), although substantial protein loss was expected. The FxClear-processed tau-GFP mouse embryo (12.5 day) showed strong tau-GFP fluorescence in blood vessels and nerve fiber layer (NFL) but little-to-no fluorescence in neural retina (Fig. 5F and Supplementary Video 1). This is very similar to the tau-GFP expression reported in this developmental stage [31]. Collectively, these data demonstrated that various thick organs can be cleared with the FxClear protocol, despite the concerns about limited tissue transparency and potential loss of proteins.
SUPPLEMENTARY MATERIALS
Supplementary video 1.
Three-dimensional visualization of the Tau-GFP positive cells and extracellular matrix in the FxClear processed Tau-GFP embryo (12.5 day) shown in Fig. 5.
DISCUSSION
Here, we established a simple and rapid tissue clearing protocol, FxClear, which is a combination of acrylamide-free tissue processing and SDS-based electrophoretic tissue clearing. It has been believed that hydrogel embedding has an advantage over other competing techniques because hydrogel additionally immobilizes the fixed protein networks by forming covalent bonds with hydrogel polymers [12]. Specifically, it transforms soft organs such as brain to a physically durable state that is sufficient to endure robust active clearing processes such as ETC [3,9]. The trade-off of this process is that the increased bonding in the hydrogel-protein complexes impedes the expansion of the tissues. Tissue expansion can increase the porosity of tissue, which is beneficial for SDS-based removal of lipids because SDS-micelles must deeply diffuse into thick specimens. Because the original version of CLARITY promotes strong acrylamide-protein conjugations, reduction of these conjugations would help reduce the duration of the delipidation step. Crosslinking of acrylamide and fixed tissues can be controlled either by adjusting the concentration of acrylamide monomers for tissue infusion or by separation of the incubation steps [32]. Separation of the formaldehyde fixation and acrylamide infusion steps in the PACT or ACT protocol considerably reduces the formation of protein-acrylamide conjugations, resulting in a much looser and more expandable tissue-hydrogel complex [23]. Therefore, the passive diffusion of SDS in PACT is applicable and tissue clearing can be achieved within a reasonable time frame. Furthermore, the use of ETC devices in the ACT protocol markedly expedites the clearing process. Although these improvements are beneficial for rapid processing, a drawback of this strategy is a strong expansion of the specimen during SDS-based de-lipidation. We reasoned that tissue expansion caused by the hydrophilicity of the acrylamide polymer enhances hyper-hydration and porosity of the specimen. Thus, enhanced porosity allows diffusion of SDS solution and de-lipidation faster. On the other hand, without acrylamide in FxClear, tissue expansion was smaller than in ACT and accordingly de-lipidation was not efficient. However, even with 30% removal of lipids, the tissue porosity measured by tau values was equivalent to the 90% removal of lipids in the ACT process [11]. Thus, it appears that the presence of acrylamide in the tissue may impede the porosity and diffusion of materials, and the removal of acrylamide from the clearing protocol is beneficial for smaller tissue expansion without losing tissue porosity.
Another problem in the use of acrylamide is the loss of immunoreactivity due to masking of epitopes by acrylamide-protein conjugation. Accordingly, CLARITY, which forms more acrylamideprotein conjugation, exhibits poorer immunoreactivity than ACT/PACT-processed tissues [9]. We found that for most of the tested antibodies, FxClear samples exhibited stronger immunolabeling signals than ACT samples (10~90% enhancement) and even stronger signals than the PFA-fixed conventional thin section-based immunolabeling results. One potential concern with the FxClear protocol is that extended ETC may damage the tissues. Quantification of protein loss revealed that prolonged ETC >12 h can cause protein loss with faster kinetics. This change may be associated with the physical damage of the tissue architecture, and thus we do not recommend long ETC treatments. Within a safe time zone (<12 h), however, only marginal (<2%) protein loss was detected. Thus, brain samples (1~2 mm) or small specimen appear to most appropriate for the FxClear technique. Thus, if the clearings of whole organs or thicker brain slices (>2 mm thickness) were desirable, other technique such as CLARITY and ACT need to be considered.
The FxClear protocol, with its relatively simple procedure and superior immunoreactivity, may be suitable for 3D imaging of many biological specimens. FxClear can reduce the processing time >50% compared with ACT by removal of the acrylamide infusion step. Considering that acrylamide is a toxic material requiring extra care during processing, FxClear is also safer than ACT. Furthermore, smaller tissue expansion may be desirable for some applications requiring precise preservation of the tissue size.
SUPPLEMENTARY MATERIAL
Supplementary video 1
Figures
References
- Nojima S, Susaki EA, Yoshida K, Takemoto H, Tsujimura N, Iijima S, Takachi K, Nakahara Y, Tahara S, Ohshima K, Kurashige M, Hori Y, Wada N, Ikeda JI, Kumanogoh A, Morii E, Ueda HR. CUBIC pathology: three-dimensional imaging for pathological diagnosis. Sci Rep 2017;7:9269.

- Tainaka K, Kubota SI, Suyama TQ, Susaki EA, Perrin D, Ukai-Tadenuma M, Ukai H, Ueda HR. Whole-body imaging with single-cell resolution by tissue decolorization. Cell 2014;159:911-924.
- Chung K, Wallace J, Kim SY, Kalyanasundaram S, Andalman AS, Davidson TJ, Mirzabekov JJ, Zalocusky KA, Mattis J, Denisin AK, Pak S, Bernstein H, Ramakrishnan C, Grosenick L, Gradinaru V, Deisseroth K. Structural and molecular interrogation of intact biological systems. Nature 2013;497:332-337.
- Hama H, Hioki H, Namiki K, Hoshida T, Kurokawa H, Ishidate F, Kaneko T, Akagi T, Saito T, Saido T, Miyawaki A. ScaleS: an optical clearing palette for biological imaging. Nat Neurosci 2015;18:1518-1529.
- Liebmann T, Renier N, Bettayeb K, Greengard P, Tessier-Lavigne M, Flajolet M. Three-dimensional study of Alzheimer's disease hallmarks using the iDISCO clearing method. Cell Reports 2016;16:1138-1152.
- Olson E, Levene MJ, Torres R. Multiphoton microscopy with clearing for three dimensional histology of kidney biopsies. Biomed Opt Express 2016;7:3089-3096.
- Lai HM, Liu AK, Ng WL, DeFelice J, Lee WS, Li H, Li W, Ng HM, Chang RC, Lin B, Wu W, Gentleman SM. Rationalisation and validation of an acrylamide-free procedure in three-dimensional histological imaging. PLoS One 2016;11:e0158628.
- Liu AK, Hurry ME, Ng OT, DeFelice J, Lai HM, Pearce RK, Wong GT, Chang RC, Gentleman SM. Bringing CLARITY to the human brain: visualization of Lewy pathology in three dimensions. Neuropathol Appl Neurobiol 2016;42:573-587.
- Lee E, Choi J, Jo Y, Kim JY, Jang YJ, Lee HM, Kim SY, Lee HJ, Cho K, Jung N, Hur EM, Jeong SJ, Moon C, Choe Y, Rhyu IJ, Kim H, Sun W. ACT-PRESTO: rapid and consistent tissue clearing and labeling method for 3-dimensional (3D) imaging. Sci Rep 2016;6:18631.
- Neckel PH, Mattheus U, Hirt B, Just L, Mack AF. Largescale tissue clearing (PACT): technical evaluation and new perspectives in immunofluorescence, histology, and ultrastructure. Sci Rep 2016;6:34331.
- Kim JH, Jang MJ, Choi J, Lee E, Song KD, Cho J, Kim KT, Cha HJ, Sun W. Optimizing tissue-clearing conditions based on analysis of the critical factors affecting tissue-clearing procedures. Sci Rep 2018;8:12815.
- Tainaka K, Kuno A, Kubota SI, Murakami T, Ueda HR. Chemical principles in tissue clearing and staining protocols for whole-body cell profiling. Annu Rev Cell Dev Biol 2016;32:713-741.
- Richardson DS, Lichtman JW. Clarifying tissue clearing. Cell 2015;162:246-257.
- Renier N, Wu Z, Simon DJ, Yang J, Ariel P, Tessier-Lavigne M. iDISCO: a simple, rapid method to immunolabel large tissue samples for volume imaging. Cell 2014;159:896-910.
- Yang B, Treweek JB, Kulkarni RP, Deverman BE, Chen CK, Lubeck E, Shah S, Cai L, Gradinaru V. Single-cell phenotyping within transparent intact tissue through whole-body clearing. Cell 2014;158:945-958.
- Susaki EA, Tainaka K, Perrin D, Kishino F, Tawara T, Watanabe TM, Yokoyama C, Onoe H, Eguchi M, Yamaguchi S, Abe T, Kiyonari H, Shimizu Y, Miyawaki A, Yokota H, Ueda HR. Whole-brain imaging with single-cell resolution using chemical cocktails and computational analysis. Cell 2014;157:726-739.
- Kuwajima T, Sitko AA, Bhansali P, Jurgens C, Guido W, Mason C. ClearT: a detergent- and solvent-free clearing method for neuronal and non-neuronal tissue. Development 2013;140:1364-1368.
- Dodt HU, Leischner U, Schierloh A, Jährling N, Mauch CP, Deininger K, Deussing JM, Eder M, Zieglgänsberger W, Becker K. Ultramicroscopy: three-dimensional visualization of neuronal networks in the whole mouse brain. Nat Methods 2007;4:331-336.
- Hama H, Kurokawa H, Kawano H, Ando R, Shimogori T, Noda H, Fukami K, Sakaue-Sawano A, Miyawaki A. Scale: a chemical approach for fluorescence imaging and reconstruction of transparent mouse brain. Nat Neurosci 2011;14:1481-1488.
- Ertürk A, Becker K, Jährling N, Mauch CP, Hojer CD, Egen JG, Hellal F, Bradke F, Sheng M, Dodt HU. Three-dimensional imaging of solvent-cleared organs using 3DISCO. Nat Protoc 2012;7:1983-1995.
- Ke MT, Fujimoto S, Imai T. SeeDB: a simple and morphology-preserving optical clearing agent for neuronal circuit reconstruction. Nat Neurosci 2013;16:1154-1161.
- Calve S, Ready A, Huppenbauer C, Main R, Neu CP. Optical clearing in dense connective tissues to visualize cellular connectivity
in situ . PLoS One 2015;10:e0116662.
- Azaripour A, Lagerweij T, Scharfbillig C, Jadczak AE, Willershausen B, Van Noorden CJ. A survey of clearing techniques for 3D imaging of tissues with special reference to connective tissue. Prog Histochem Cytochem 2016;51:9-23.
- Jensen KH, Berg RW. Advances and perspectives in tissue clearing using CLARITY. J Chem Neuroanat 2017;86:19-34.
- Murray E, Cho JH, Goodwin D, Ku T, Swaney J, Kim SY, Choi H, Park YG, Park JY, Hubbert A, McCue M, Vassallo S, Bakh N, Frosch MP, Wedeen VJ, Seung HS, Chung K. Simple, scalable proteomic imaging for high-dimensional profiling of intact systems. Cell 2015;163:1500-1514.
- Perbellini F, Liu AK, Watson SA, Bardi I, Rothery SM, Terracciano CM. Free-of-Acrylamide SDS-based Tissue Clearing (FASTClear) for three dimensional visualization of myocardial tissue. Sci Rep 2017;7:5188.
- El-Sherbiny IM, Yacoub MH. Hydrogel scaffolds for tissue engineering: progress and challenges. Glob Cardiol Sci Pract 2013;2013:316-342.
- Ariel P. A beginner's guide to tissue clearing. Int J Biochem Cell Biol 2017;84:35-39.
- Kim JY, Kim HJ, Jang MJ, Kim JH, Lee JH, Lee E, Park K, Kim H, Lee J, Kwag J, Kim N, Song MR, Kim H, Sun W. BrainFilm, a novel technique for physical compression of 3D brain slices for efficient image acquisition and post-processing. Sci Rep 2018;8:8531.
- Tuchin VV. Optical clearing of tissues and blood. Bellingham, WA: SPIE Press, 2006.
- Sharp L, Pratt T, MacKay GE, Keighren MA, Flockhart JH, Chandler EJ, Price DJ, Mason JO, West JD. Comparison of two related lines of tauGFP transgenic mice designed for lineage tracing. BMC Dev Biol 2017;17:8.
- Ku T, Swaney J, Park JY, Albanese A, Murray E, Cho JH, Park YG, Mangena V, Chen J, Chung K. Multiplexed and scalable super-resolution imaging of three-dimensional protein localization in size-adjustable tissues. Nat Biotechnol 2016;34:973-981.