Articles

Article Tools
 View Full Text View Full Text |
 Abstract Abstract |
 Article as PDF Article as PDF |
 Print this Article Print this Article |
 Pubmed Pubmed |
 PMC PMC |
 PubReader PubReader |
 Export to Citation Export to Citation |
 Email Alerts Email Alerts |
 Open Access Open Access |
Share this article on :


Stats or Metrics
Article
Original Article
Exp Neurobiol 2023; 32(1): 20-30
Published online February 28, 2023
https://doi.org/10.5607/en22042
© The Korean Society for Brain and Neural Sciences
Differential Encoding of Trace and Delay Fear Memory in the Entorhinal Cortex
Mi-Seon Kong1, Namsoo Kim2, Kyeong Im Jo3, Sung-Phil Kim4 and June-Seek Choi3*
1Department of Psychiatry and Behavioral Sciences, University of Washington, Seattle 98195, WA, 2Janelia Research Campus, Howard Hughes Medical Institute, Ashburn 20147, VA, USA, 3School of Psychology, Korea University, Seoul 02841, 4Department of Biomedical Engineering, Ulsan National Institute of Science and Technology (UNIST), Ulsan 44919, Korea
Correspondence to: *To whom correspondence should be addressed.
TEL: 82-2-3290-2069, FAX: 82-2-3290-2662
e-mail: j-schoi@korea.ac.kr
This is an Open Access article distributed under the terms of the Creative Commons Attribution Non-Commercial License (http://creativecommons.org/licenses/by-nc/4.0) which permits unrestricted non-commercial use, distribution, and reproduction in any medium, provided the original work is properly cited.
Abstract
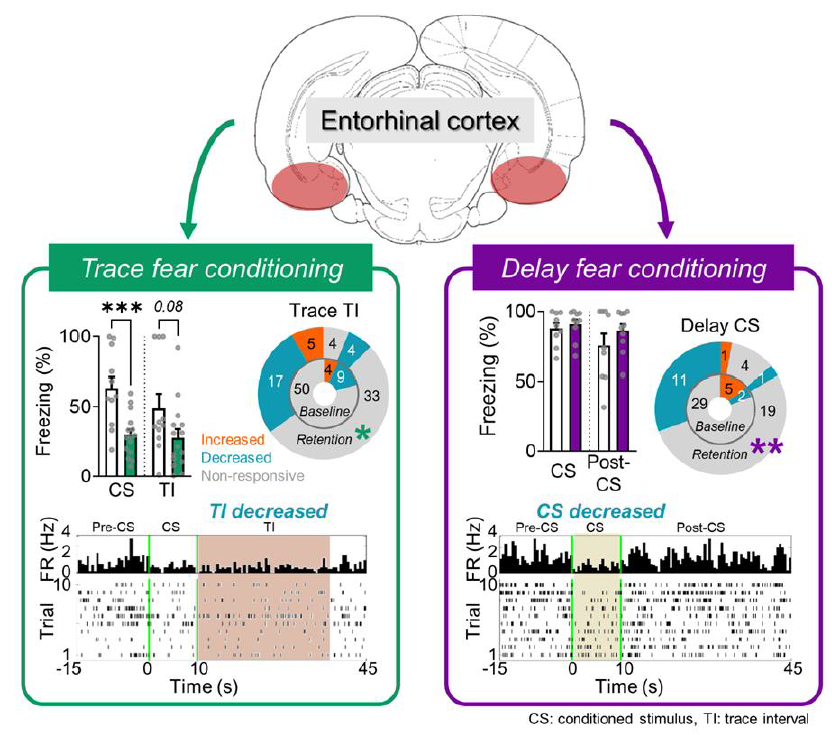
Trace fear conditioning is characterized by a stimulus-free trace interval (TI) between the conditioned stimulus (CS) and the unconditioned stimulus (US), which requires an array of brain structures to support the formation and storage of associative memory. The entorhinal cortex (EC) has been proposed to provide essential neural code for resolving temporal discontinuity in conjunction with the hippocampus. However, how the CS and TI are encoded at the neuronal level in the EC is not clear. In Exp. 1, we tested the effect of bilateral pre-training electrolytic lesions of EC on trace vs. delay fear conditioning using rats as subjects. We found that the lesions impaired the acquisition of trace but not delay fear conditioning confirming that EC is a critical brain area for trace fear memory formation. In Exp. 2, single-unit activities from EC were recorded during the pre-training baseline and post-training retention sessions following trace or delay conditioning. The recording results showed that a significant proportion of the EC neurons modulated their firing during TI after the trace conditioning, but not after the delay fear conditioning. Further analysis revealed that the majority of modulated units decreased the firing rate during the TI or the CS. Taken together, these results suggest that EC critically contributes to trace fear conditioning by modulating neuronal activity during the TI to facilitate the association between the CS and US across a temporal gap.
Graphical Abstract
Keywords: Fear, Memory, Conditioning, Entorhinal cortex
INTRODUCTION
Pavlovian fear conditioning is a model paradigm to investigate how the predictive relation between stimuli is learned and utilized. In typical fear conditioning, an initially neutral stimulus (conditioned stimulus, CS) such as a tone, is followed by a threat stimulus (unconditioned stimulus, US) such as a tactile pain and becomes a potent signal to elicit an array of defensive behaviors as well as sympathetic and endocrinal activation [1-3]. Temporal relationship between the two stimuli divides fear conditioning into two distinct categories: Delay conditioning is characterized by continuity between stimuli and trace conditioning by a stimulus-free gap, or trace interval (TI) between the CS and US. Delay and trace conditioning differ by several characteristics. Most notably, trace conditioning requires temporary memory storage and awareness of the stimulus contingency during the TI [4, 5], making the paradigm advantageous for investigating explicit memory with broad implications for human cognitive functions.
There are several brain regions that were found to be involved in trace fear conditioning, including the hippocampus [6-12], medial prefrontal cortex (mPFC) [8, 13-15], anterior cingulate cortex (ACC) [16, 17], perirhinal cortex [18, 19], and entorhinal cortex (EC) [20-23]. Among them, EC has been proposed to be a crucial structure to encode CS due to its anatomical and physiological features. The EC is interconnected with the amygdala and hippocampus by receiving strong inputs from the amygdala and relaying them to the hippocampus [24]. Especially, the inputs from the EC to the hippocampus have been shown to be necessary for temporal associative learning, including trace fear conditioning [20]. Another demonstration of the selective role of the EC in trace fear conditioning is that pre-training excitotoxic lesions of the EC showed impairment in trace fear but not in delay fear conditioning [21].
Despite the importance of the EC in trace conditioning, there is still a lack of understanding of how EC neurons encode trace fear conditioning while animals are behaving, especially focusing on the neural coding of the TI. To elucidate the key mnemonic process in trace fear memory, we investigated how trace fear conditioning changed neural activity in the EC by comparing pre- and post-training activity of EC neurons using
MATERIALS AND METHODS
Subjects
Male Sprague-Dawley rats (210~315 g; Orient Bio, Gyeonggi-do, Korea) were housed individually in a climate-controlled vivarium and maintained on a 12-h reversed light/dark cycle (lights on at 9 p.m.) with
Surgery
Animals were fully anesthetized with sodium pentobarbital (60 mg/kg, i.p.) and fixed in a stereotaxic apparatus (David Kopf Instruments, Tujunga, CA). For the behavioral experiment, a lesion electrode (0.3 mm in diameter, insulated with Epoxylite except for the 0.5 mm tip) was lowered until it reached the EC (two lesion sites bilaterally; AP: -6.8 mm, ML: ±5.0 mm, DV: -7.0 mm from dura; AP: -8.0 mm, ML: ±5.0 mm, DV: -5.0 mm from dura). Electrolytic lesions (n=26) were made with an adonal current (1.0 mA for 20 s at each site). The sham surgery was identical to lesion surgery except that no current was introduced (n=19). Following the procedure, the incision was sutured. For
Behavioral apparatus
Two distinct contexts (A and B) were used for the experiments. Context A was composed of a transparent Plexiglas chamber (30 cm×25 cm×20 cm) equipped with a grid floor (16 stainless steel rods, 5 mm in diameter) and blue house light. For context B, padding materials (Aspan, Orient Bio, Kyunggi-do, Korea) and red house light were added to the same transparent Plexiglas chamber as context A. In both context chambers, a speaker (8 cm×4 cm, 8 Ω) for presenting a tone and a DC fan for ventilation were attached to the wall. All experiments were conducted in a sound-attenuating cubicle (48 cm×55 cm×45 cm) so that the external noise could not disrupt the behavior experiments. A video camera for monitoring and recording the animal’s behavior was fixed on the sidewall of the cubicle. The apparatus was cleaned between sessions with a 70% ethanol solution.
Behavioral procedure and analysis
Exp. 1
As illustrated in Fig. 1a, all animals were first acclimated to context A and B for 10 minutes each, followed by three CS presentations (10 s, 5 kHz, 80 dB, Coulbourn Instruments, Whitehall, PA) with 120 s interval between the CSs (
The behavioral index of fear learning was assessed by freezing (defined as the absence of movement except for respiration [25]). Two experimenters who were blind to the experimental condition scored freezing responses from the recorded video during the CS and TI (or 30 s after the CS). A custom-written program was used to keep track of scoring and to compute total freezing time.
Exp. 2
The procedure for the recording experiment is shown in Fig. 2a. All rats were habituated to context A and B for 10 minutes each and were placed back in their home cages (
In vivo single-unit recording, spike sorting and data analysis
For the
Sorted unit activity was binned into 100-ms bins for further analyses and normalized to the pre-CS period (20 s) using a z-score transformation. Significant firing rate change was confirmed by when the mean firing rate during the CS/TI was statistically different from the firing rate of the pre-CS period. Neural responses were categorized into one of the four patterns: CS-increased, CS-decreased (both a sustained change in firing rate during the CS presentation), TI (post-CS)-increased, and TI (post-CS)-decreased (both a sustained change in firing rate during the TI or post-CS presentation).
Histology
Histological verification of the lesion site was performed after all the experimental procedures were completed (Fig. 1b, 2b). Animals were fully anesthetized with an overdose of pentobarbital sodium (120 mg/kg, i.p.) and perfused intracardially with a 0.9% saline and 10% paraformaldehyde solution. For the recording experiment, small lesions were made (5 of 16 wires, 100 μA, 8 s each) before the perfusion to check the locations of the electrode tips. The brains were removed and stored in a 30% sucrose solution overnight. Coronal slices (50 μm thick) cut by a tabletop microtome (Leica SM2000R, Leica Microsystems, Richmond Hill, Ontario, Canada) were mounted on gelatin-coated slides and stained with a 2% potassium ferrocyanide solution and cresyl violet. Stained slides were cover-slipped with Permount (Fisher Scientific, Hampton, NH) and examined under a microscope. Reconstructions of the lesion sites/recording tips were made on the rat brain atlas [28].
Statistical analysis
To compare freezing responses during the CS and TI, all behavioral data were transformed to a percent of total CS or TI duration. The statistical significance was determined with repeated measures ANOVA (
RESULTS
Exp.1: electrolytic lesions of EC disrupted the trace but not delay fear conditioning
During the acquisition of trace conditioning, a repeated measures ANOVA revealed that there was a significant effect of conditioning trials (
During the retention test, however, there were significant effects of conditioning trials (
The reduction of freezing to the CS in Tracelesion was more evident during the first five trials of the retention session as revealed by the independent
For the delay conditioning group, a repeated measures ANOVA revealed that there was a significant effect of conditioning trials (
During the retention test, there was a significant effect of conditioning trials (
Exp. 2: distinct modulations of the EC neurons during trace vs. delay fear conditioning
To examine how the EC encodes trace fear conditioning distinctively compared to other types of fear learning, three groups of rats underwent trace, delay, or unpaired fear conditioning (Trace, Delay, or Unpaired). Similar to the behavioral results from Exp. 1, trace and delay fear conditioning induced freezing to the CS (Trace:
Next, single-unit activities from EC neurons were analyzed. During the baseline session, EC neurons from the three groups of rats showed a comparable level of firing. Specifically, the overall baseline firing rates were not statistically different among the three groups (Trace=1.43±0.95 Hz from 63 cells; Delay=1.53±1.19 Hz from 36 cells; Unpaired=1.76±1.12 Hz from 61 cells,
To identify the mode of modulation, firing rates during the CS and TI (post-CS) were compared to that during the pre-CS period (20 s prior to the CS onset). Table 1 shows the number of responsive and non-responsive cells during trace, delay and unpaired conditioning. In Trace, proportions of CS-, TI-, CS+TI- and non-responsive cells during the retention session changed compared to the baseline session: an increased number of cells responded to the TI and the CS+TI (13 cells→26 cells; χ2 (3, n=63)=7.032, p=0.0709, Chi-Square Test). The increased number of CS+post-CS-responsive cells during the retention session was also found in Delay (not statistically significant, 2 cells→8 cells; χ2 (3, n=36)=4.464, p=0.2156, Chi-square test) but not in Unpaired (χ2 (3, n=61)=0.9354, p=0.2156, Chi-square test). Interestingly, significant changes in the proportion of responsive cells were found in cells that showed decreased firing rates during the CS or TI (Fig. 3a, b). After trace fear conditioning, significantly more cells showed TI-modulated responses, especially by decreasing their firing rates during the TI (χ2 (2, n=63)=6.854, p<0.05, Chi-square test). On the other hand, delay fear conditioning led to more cells decreasing their firing rates during the CS (χ2 (2, n=36)=10.50, p<0.01, Chi-square test). None of these trends was found in Unpaired (χ2 (2, n=61)=0.7802, p=0.6770, Chi-square test).
In addition to the proportions of responsive cells, we investigated how the neuronal responses are modulated throughout the acquisition of CR by tracking the activity during the baseline and retention sessions (Fig. 3c). Z-scored heatmaps between baseline and retention sessions illustrate learning-induced firing changes during the CS and TI in all three groups. There was a considerable shift in the neural response before and after conditioning. For example, cells showed CS- or TI (post-CS)-modulated firing before learning, but after learning, a different set of cells became CS- or TI (post-CS)-responsive. This trend was found in all three groups, yet a significant proportion was changed during the CS in Delay (Fig. 3d, χ2 (2, n=36)=10.50, p<0.01, Chi-square test) and during the TI in Trace (Fig. 3e, χ2 (2, n=63)=6.854, p<0.05, Chi-square test). These results indicate that more cells were engaged during the CS after delay fear conditioning, and more cells were engaged during the TI after trace fear conditioning. These also coincide with the behavioral changes where rats showed more freezing responses during the CS after delay fear conditioning and more freezing responses during the TI after trace fear conditioning (Fig. 2c).
To examine the conditioning-induced modulation further, we compared the firing rates of CS and TI (post-CS)-responsive cells during the retention session with those from the baseline session. Independent
Instead, CS- and TI-decreased cells in Trace during the retention session showed significantly lower firing rates compared to those from the baseline session (CS:
DISCUSSION
In the current study, we found that EC is not only critical for trace fear conditioning but also maintains significant modulation of neural activity during the stimulus-free trace interval. Bilateral lesions of the EC attenuated conditioned freezing during the retention session following trace conditioning. The same lesion had no effect on the fear memory of delay conditioning. The preferential role of the EC in trace fear learning has been reported by multiple studies using various techniques [21, 22, 29], and the underlying mechanisms are thought to be through monosynaptic connections with the hippocampus [30]. The entorhinal-hippocampal circuit has been suggested as a primary substrate for temporal associative learning and memory by bridging the temporally discontinuous stimuli [20, 31, 32].
A possible mechanism for ‘filling the gap’ between the CS and US would require maintaining neuronal activity representing the CS during the TI without the overt presence of the CS. This, ‘eligibility trace’ is essential for plasticity in various theoretical models as it provides a temporal window for associating the US with the CS trace [33, 34]. Indeed, several studies have shown that EC neurons display sustained activity during the delay phase of delayed match or nonmatching to sample tasks [35, 36]. Moreover, slice electrophysiology studies found ‘persistent firing’ neurons in the EC [37-39]. A model proposed by Kitamura et al. explains the distinctive neural circuits for delay vs. trace fear conditioning, which involves persistent firing neurons in the EC and feed-forward inhibition by the EC for the fine-tuned memory process of the hippocampus [31, 32].
In line with the previous models at various conceptual and mechanistic levels, the current study found a learning-related modulation of neural dynamics within the EC during the trace interval. The number of TI-responsive neurons were increased following trace fear conditioning. This includes CS+TI-responsive neurons, where more than half of the TI-responsive cells were also CS-modulated (n=15, 58%). Surprisingly, EC neurons also responded to the CS following delay fear conditioning, which would suggest that EC neurons might be responsive to multiple learning-relevant stimuli even though they are critically involved only in trace conditioning. Considering the results from the lesion experiment, CS-responsive neurons in EC might play a secondary role in delay fear conditioning as the critical locus of delay fear memory is in other areas [1].
The most unexpected finding was that a majority of EC cells responded to the CS and/or TI with decrease in firing rates. Based on previous studies [21, 37], we hypothesized that the EC neurons would show persistent activity during the TI to maintain the associability of the trace CS with the temporally distant US. In an
If the critical contribution of the EC to trace fear conditioning is mediated by increased depression of the neuronal activity during TI, it is reasonable to speculate that an additional brain circuit might be required to support the temporally discontinuous association between the CS and US. One such candidate is the hippocampus, which has been implicated as a critical structure for trace fear conditioning [21, 37, 40]. Based on a finding that a long-range inhibitory projection (LRIP) from the EC fine-tunes hippocampal-dependent memory by promoting the integration of multisensory inputs, a recent study proposed that the EC-hipppocampal modulation would mainly involve disinhibition [41]. Specifically, selective inhibition of the long-range inhibitory projection to the hippocampal CA1 interneurons resulted in increased fear response to the conditioning context and overgeneralized fear to a novel context. Conceptually, the decreased firing of EC neurons during the CS/TI as found in the current study proposes that the mnemonic contribution of the EC to trace conditioning is completed within the integrated EC-hippocampal circuit via LRIP.
Alternatively, the decreased firing rate might be a result of reduced movement as the rats showed increased freezing after trace conditioning. For example, neurons in the anterior cingulate cortex (ACC) modulate the firing rate in relation to the speed of movement such that ACC neurons increase firing rates when animals terminate freezing behaviors [16]. Therefore, the down-regulation of EC neuronal activity in the current study could partially originate from the EC (EC→ACC). It is equally plausible to assume that the decreased activity of EC neurons may be the outcome of the decreased activity of ACC neurons (ACC→EC) because the EC and ACC are reciprocally connected direct projections [42, 43]. A distinct population of cells in the medial EC that respond positively to running speed (i.e., speed cells) supports the relationship between the firing rate and running speed [44, 45]. However, the current study recorded from the lateral EC, not from the medial EC, and functional dissociation between the medial and lateral EC has been widely reported (spatial vs. temporal) [46]. In addition, we found no correlation between movement speed and EC neuronal activity during the baseline session, providing little support for the motoric account of the current results.
To sum up, the current study suggests a new role for the EC in trace fear conditioning by uncovering a unique pattern of neural activity, a learning-related decrease in firing rate, during the CS and TI. Although several previous studies unequivocally argued for the critical role of the EC in trace fear conditioning as the current results also have confirmed, the findings from the recording experiment shed a new light on a circuit-level understanding of the mnemonic processing responsible for temporal associative learning. Further studies are warranted to identify the precise role of the EC in trace fear conditioning via its functional connections with multiple brain regions such as the hippocampus and prefrontal cortex.
ACKNOWLEDGEMENTS
This work was supported by the National Research Foundation of Korea (NRF-2020R1A2C2014830, June-Seek Choi), the Brain Convergence Research Program (2021M3E5D2A01023887, June-Seek Choi) (funded by the Korean Government, MSIT), and the National Institute of Mental Health (F32MH127801, Mi-Seon Kong).
Figures


Tables
The number of CS-, TI (post-CS)-, CS+TI-, and non-responsive cells from Trace, Delay, and Unpaired during the baseline and retention sessions and the number of increased and decreased cells during the CS and TI (post-CS) from the three groups. *p<0.05, **p<0.01
| Response pattern | Trace (63) | Delay (36) | Unpaired (61) | |||||
|---|---|---|---|---|---|---|---|---|
| Baseline | Retention | Baseline | Retention | Baseline | Retention | |||
| CS-responsive | 7 | 3 | 5 | 5 | 8 | 6 | ||
| TI-responsive | 5 | 11 | 5 | 3 | 11 | 10 | ||
| CS+TI-responsive | 8 | 15 | 2 | 8 | 9 | 7 | ||
| Non-responsive | 43 | 34 | 24 | 20 | 33 | 38 | ||
| CS | Baseline | Retention | Baseline | Retention | Baseline | Retention | ||
| Total responsive | 15 (24%) | 18 (29%) | 7 (19%) | 13 (36%)** | 17 (28%) | 13 (21%) | ||
| Increased | 5 | 2 | 5 | 1 | 10 | 7 | ||
| Decreased | 10 | 16 | 2 | 12 | 7 | 6 | ||
| TI (post-CS) | Baseline | Retention | Baseline | Retention | Baseline | Retention | ||
| Total responsive | 13 (21%) | 26 (41%)* | 7 (19%) | 13(29%) | 20 (33%) | 16 (26%) | ||
| Increased | 4 | 5 | 1 | 1 | 6 | 4 | ||
| Decreased | 9 | 21 | 6 | 12 | 14 | 12 | ||
References
- LeDoux JE (2000) Emotion circuits in the brain. Annu Rev Neurosci 23:155-184


- Maren S (2001) Neurobiology of Pavlovian fear conditioning. Annu Rev Neurosci 24:897-931
- Fendt M, Fanselow MS (1999) The neuroanatomical and neurochemical basis of conditioned fear. Neurosci Biobehav Rev 23:743-760
- Carter RM, Hofstotter C, Tsuchiya N, Koch C (2003) Working memory and fear conditioning. Proc Natl Acad Sci U S A 100:1399-1404

- Knight DC, Nguyen HT, Bandettini PA (2006) The role of awareness in delay and trace fear conditioning in humans. Cogn Affect Behav Neurosci 6:157-162
- McEchron MD, Bouwmeester H, Tseng W, Weiss C, Disterhoft JF (1998) Hippocampectomy disrupts auditory trace fear conditioning and contextual fear conditioning in the rat. Hippocampus 8:638-646
- Solomon PR, Vander Schaaf ER, Thompson RF, Weisz DJ (1986) Hippocampus and trace conditioning of the rabbit's classically conditioned nictitating membrane response. Behav Neurosci 100:729-744
- Runyan JD, Moore AN, Dash PK (2004) A role for prefrontal cortex in memory storage for trace fear conditioning. J Neurosci 24:1288-1295
- Bangasser DA, Waxler DE, Santollo J, Shors TJ (2006) Trace conditioning and the hippocampus: the importance of contiguity. J Neurosci 26:8702-8706
- McEchron MD, Tseng W, Disterhoft JF (2003) Single neurons in CA1 hippocampus encode trace interval duration during trace heart rate (fear) conditioning in rabbit. J Neurosci 23:1535-1547
- Pang MH, Kim NS, Kim IH, Kim H, Kim HT, Choi JS (2010) Cholinergic transmission in the dorsal hippocampus modulates trace but not delay fear conditioning. Neurobiol Learn Mem 94:206-213
- Seo DO, Pang MH, Shin MS, Kim HT, Choi JS (2008) Hippocampal NMDA receptors are necessary for auditory trace fear conditioning measured with conditioned hypoalgesia in rats. Behav Brain Res 192:264-268
- McLaughlin J, Skaggs H, Churchwell J, Powell DA (2002) Medial prefrontal cortex and pavlovian conditioning: trace versus delay conditioning. Behav Neurosci 116:37-47
- Gilmartin MR, McEchron MD (2005) Single neurons in the medial prefrontal cortex of the rat exhibit tonic and phasic coding during trace fear conditioning. Behav Neurosci 119:1496-1510
- Park EH, Kim NS, Lee YK, Choi JS (2022) N-methyl-D-aspartate (NMDA) receptors in the prelimbic cortex are required for short- and long-term memory formation in trace fear conditioning. Life (Basel) 12:672
- Steenland HW, Li XY, Zhuo M (2012) Predicting aversive events and terminating fear in the mouse anterior cingulate cortex during trace fear conditioning. J Neurosci 32:1082-1095
- Han CJ, O'Tuathaigh CM, van Trigt L, Quinn JJ, Fanselow MS, Mongeau R, Koch C, Anderson DJ (2003) Trace but not delay fear conditioning requires attention and the anterior cingulate cortex. Proc Natl Acad Sci U S A 100:13087-13092
- Bang SJ, Brown TH (2009) Muscarinic receptors in perirhinal cortex control trace conditioning. J Neurosci 29:4346-4350
- Kholodar-Smith DB, Boguszewski P, Brown TH (2008) Auditory trace fear conditioning requires perirhinal cortex. Neurobiol Learn Mem 90:537-543
- Suh J, Rivest AJ, Nakashiba T, Tominaga T, Tonegawa S (2011) Entorhinal cortex layer III input to the hippocampus is crucial for temporal association memory. Science 334:1415-1420
- Esclassan F, Coutureau E, Di Scala G, Marchand AR (2009) A cholinergic-dependent role for the entorhinal cortex in trace fear conditioning. J Neurosci 29:8087-8093
- Ryou JW, Cho SY, Kim HT (2001) Lesions of the entorhinal cortex impair acquisition of hippocampal-dependent trace conditioning. Neurobiol Learn Mem 75:121-127
- Tanninen SE, Morrissey MD, Takehara-Nishiuchi K (2013) Unilateral lateral entorhinal inactivation impairs memory expression in trace eyeblink conditioning. PLoS One 8:e84543
- Pitkänen A, Pikkarainen M, Nurminen N, Ylinen A (2000) Reciprocal connections between the amygdala and the hippocampal formation, perirhinal cortex, and postrhinal cortex in rat. A review. Ann N Y Acad Sci 911:369-391
- Blanchard RJ, Blanchard DC (1969) Passive and active reactions to fear-eliciting stimuli. J Comp Physiol Psychol 68:129-135
- Burman MA, Gewirtz JC (2004) Timing of fear expression in trace and delay conditioning measured by fear-potentiated startle in rats. Learn Mem 11:205-212
- Kim N, Kong MS, Jo KI, Kim EJ, Choi JS (2015) Increased tone-offset response in the lateral nucleus of the amygdala underlies trace fear conditioning. Neurobiol Learn Mem 126:7-17
- Paxinos G, Watson C (2006) The rat brain in stereotaxic coordinates. 6th ed. Academic Press, Oxford
- Morrissey MD, Maal-Bared G, Brady S, Takehara-Nishiuchi K (2012) Functional dissociation within the entorhinal cortex for memory retrieval of an association between temporally discontiguous stimuli. J Neurosci 32:5356-5361
- Kohara K, Pignatelli M, Rivest AJ, Jung HY, Kitamura T, Suh J, Frank D, Kajikawa K, Mise N, Obata Y, Wickersham IR, Tonegawa S (2014) Cell type-specific genetic and optogenetic tools reveal hippocampal CA2 circuits. Nat Neurosci 17:269-279
- Kitamura T, Macdonald CJ, Tonegawa S (2015) Entorhinal-hippocampal neuronal circuits bridge temporally discontiguous events. Learn Mem 22:438-443
- Kitamura T, Pignatelli M, Suh J, Kohara K, Yoshiki A, Abe K, Tonegawa S (2014) Island cells control temporal association memory. Science 343:896-901
- Moore JW, Choi JS (1998) Conditioned stimuli are occasion setters. In: Occasion setting: associative learning and cognition in animals (Schmajuk NA, Holland PC, eds), pp 279-318. American Psychological Association, Washington, D.C
- Grossberg S, Schmajuk NA (1989) Neural dynamics of adaptive timing and temporal discrimination during associative learning. Neural Networks 2:79-102
- Young BJ, Otto T, Fox GD, Eichenbaum H (1997) Memory representation within the parahippocampal region. J Neurosci 17:5183-5195
- Suzuki WA, Miller EK, Desimone R (1997) Object and place memory in the macaque entorhinal cortex. J Neurophysiol 78:1062-1081
- Egorov AV, Hamam BN, Fransén E, Hasselmo ME, Alonso AA (2002) Graded persistent activity in entorhinal cortex neurons. Nature 420:173-178
- Fransén E, Tahvildari B, Egorov AV, Hasselmo ME, Alonso AA (2006) Mechanism of graded persistent cellular activity of entorhinal cortex layer v neurons. Neuron 49:735-746
- Tahvildari B, Fransén E, Alonso AA, Hasselmo ME (2007) Switching between "on" and "off" states of persistent activity in lateral entorhinal layer III neurons. Hippocampus 17:257-263
- Lin C, Sherathiya VN, Oh MM, Disterhoft JF (2020) Persistent firing in LEC III neurons is differentially modulated by learning and aging. Elife 9:e56816
- Basu J, Zaremba JD, Cheung SK, Hitti FL, Zemelman BV, Losonczy A, Siegelbaum SA (2016) Gating of hippocampal activity, plasticity, and memory by entorhinal cortex long-range inhibition. Science 351:aaa5694
- Sakata H, Kim Y, Nejime M, Konoike N, Miyachi S, Nakamura K (2019) Laminar pattern of projections indicates the hierarchical organization of the anterior cingulate-temporal lobe emotion system. Front Neuroanat 13:74
- Nilssen ES, Doan TP, Nigro MJ, Ohara S, Witter MP (2019) Neurons and networks in the entorhinal cortex: a reappraisal of the lateral and medial entorhinal subdivisions mediating parallel cortical pathways. Hippocampus 29:1238-1254
- Kropff E, Carmichael JE, Moser MB, Moser EI (2015) Speed cells in the medial entorhinal cortex. Nature 523:419-424
- Hinman JR, Brandon MP, Climer JR, Chapman GW, Hasselmo ME (2016) Multiple running speed signals in medial entorhinal cortex. Neuron 91:666-679
- Witter MP, Doan TP, Jacobsen B, Nilssen ES, Ohara S (2017) Architecture of the entorhinal cortex A review of entorhinal anatomy in rodents with some comparative notes. Front Syst Neurosci 11:46