Articles

Article Tools
 View Full Text View Full Text |
 Abstract Abstract |
 Article as PDF Article as PDF |
 Print this Article Print this Article |
 Pubmed Pubmed |
 PMC PMC |
 PubReader PubReader |
 Export to Citation Export to Citation |
 Email Alerts Email Alerts |
 Open Access Open Access |
Share this article on :


Stats or Metrics
Article
Original Article
Exp Neurobiol 2023; 32(3): 170-180
Published online June 30, 2023
https://doi.org/10.5607/en23016
© The Korean Society for Brain and Neural Sciences
Machine Learning-assisted Quantitative Mapping of Intracortical Axonal Plasticity Following a Focal Cortical Stroke in Rodents
Hyung Soon Kim1,2, Hyo Gyeong Seo1,2, Jong Ho Jhee4, Chang Hyun Park5, Hyang Woon Lee6,7, Bumhee Park8,9 and Byung Gon Kim1,2,3*
1Department of Brain Science, Ajou University School of Medicine, Suwon 16499, 2Neuroscience Graduate Program, Department of Biomedical Science, Ajou University Graduate School of Medicine, Suwon 16499, 3Department of Neurology, Ajou University School of Medicine, Suwon 16499, 4Center for KIURI Bio-Artificial Intelligence, Ajou University School of Medicine, Suwon 16499, 5Division of Artificial Intelligence and Software, College of Engineering, Ewha Womans University, Seoul 03760, 6Department of Neurology and Medical Science, Ewha Womans University School of Medicine and Ewha Medical Research Institute, Seoul 03760, 7Computational Medicine, Graduate Programs in System Health Science & Engineering and Artificial Intelligence Convergence, Ewha Womans University, Seoul 03760, 8Department of Biomedical Informatics, Ajou University School of Medicine, Suwon 16499, 9Office of Biostatistics, Medical Research Collaborating Center, Ajou Research Institute for Innovative Medicine, Ajou University Medical Center, Suwon 16499, Korea
Correspondence to: *To whom correspondence should be addressed.
TEL: 82-31-219-4495, FAX: 82-31-219-4444
e-mail: kimbg@ajou.ac.kr
This is an Open Access article distributed under the terms of the Creative Commons Attribution Non-Commercial License (http://creativecommons.org/licenses/by-nc/4.0) which permits unrestricted non-commercial use, distribution, and reproduction in any medium, provided the original work is properly cited.
Abstract
Stroke destroys neurons and their connections leading to focal neurological deficits. Although limited, many patients exhibit a certain degree of spontaneous functional recovery. Structural remodeling of the intracortical axonal connections is implicated in the reorganization of cortical motor representation maps, which is considered to be an underlying mechanism of the improvement in motor function. Therefore, an accurate assessment of intracortical axonal plasticity would be necessary to develop strategies to facilitate functional recovery following a stroke. The present study developed a machine learning-assisted image analysis tool based on multi-voxel pattern analysis in fMRI imaging. Intracortical axons originating from the rostral forelimb area (RFA) were anterogradely traced using biotinylated dextran amine (BDA) following a photothrombotic stroke in the mouse motor cortex. BDA-traced axons were visualized in tangentially sectioned cortical tissues, digitally marked, and converted to pixelated axon density maps. Application of the machine learning algorithm enabled sensitive comparison of the quantitative differences and the precise spatial mapping of the post-stroke axonal reorganization even in the regions with dense axonal projections. Using this method, we observed a substantial extent of the axonal sprouting from the RFA to the premotor cortex and the peri-infarct region caudal to the RFA. Therefore, the machine learningassisted quantitative axonal mapping developed in this study can be utilized to discover intracortical axonal plasticity that may mediate functional restoration following stroke.
Graphical Abstract
Keywords: Ischemic stroke, Motor cortex, Neuronal plasticity, Machine learning, Support vector machine, Neuroanatomical tract-tracing techniques
INTRODUCTION
Acute destructive lesions to CNS, such as cerebrovascular accidents or traumatic injuries, lead to focal neurological deficits in various domains of neural functions. Although pathogenic insults causing tissue damage do not linger for several days or a couple of weeks, recovery of impaired neurological functions is principally limited with most inflicted patients permanently disabled. However, many patients exhibit some degree of spontaneous functional recovery, especially within the first several months after the initial injury [1-4]. Following a stroke, motor functions typically improve within three months post-stroke [5, 6]. Cellular and molecular substrates underlying the spontaneous functional recovery remain to be elucidated. Notably, potential restorative therapies facilitating functional recovery following stroke leverage mechanisms similar to those subserving spontaneous motor recovery [7, 8], highlighting the substantial relevance of studying cellular and molecular events enabling post-stroke functional restoration.
The reorganization of neural circuits is supposed to be involved in functional improvement following CNS lesions [9, 10]. Functional potentiation of existing neural connections may contribute to the rewiring of cortical neural circuits within a short time scale [11]. However, structural reorganization or remodeling of neural circuits is supposed to be accompanied by the formation of new synapses and the growth of axonal or dendritic processes. Notably, large-scale axonal sprouting occurs where a great extent of functional reorganization in the cerebral cortex is expected [12, 13]. In animal models of stroke, ischemic damage is accompanied by axonal sprouting at the peri-infarct area that may contribute to the re-establishment of local circuits for endogenous functional recovery [14, 15]. Furthermore, experimental strategies that successfully promoted functional recovery following stroke enhanced post-stroke axonal sprouting [16-18]. Thus, accurate and quantitative assessment of axonal sprouting or plasticity would be crucial in evaluating the influence of any interventional strategy on neural circuit reorganization and functional restoration following stroke.
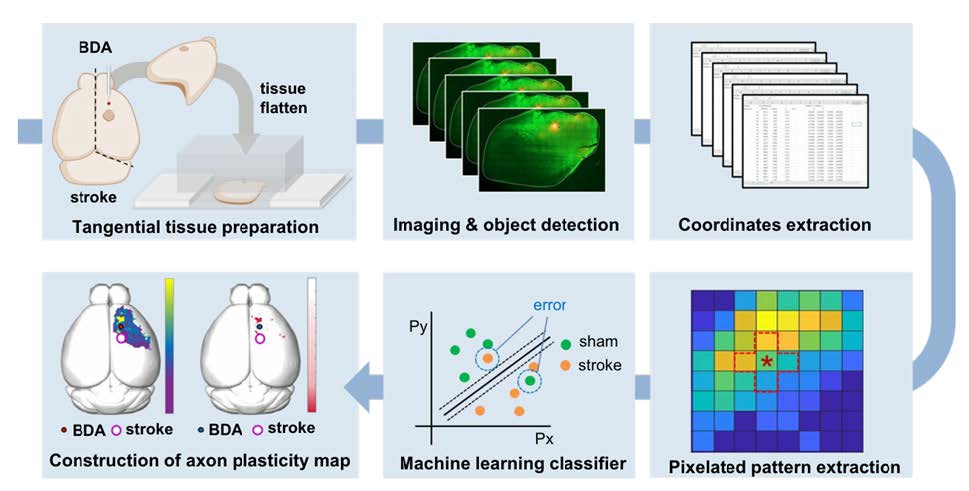
The extent of axonal plasticity is often assessed by measuring the density of anterogradely traced axonal processes within designated regions of interest. This simple method would work well when the measurement is being processed in the subcortical areas where axon density is not too high and axonal processes sprout in predictable and iterative patterns. However, intracortical axons grow in an overwhelmingly large number to communicate with neurons in parallelly connected different cortical regions. Moreover, the directional preference of axonal sprouting following cortical lesions is highly variable, making the simple quantitative comparison very challenging. The present study aimed to develop a method based on a machine learning algorithm that allows for sensitive and quantitative comparisons of intracortical axonal plasticity. A schematic diagram of the process is illustrated in Fig. 1. This method, which is referred to as multi-pixel pattern analysis (MPPA) in this study, borrows a concept of the muti-voxel pattern analysis (MVPA) for the quantitative analysis of functional MRI (fMRI) data. MVPA is a machine learning and pattern recognition-based imaging analysis algorithm [19]. Compared to the conventional fMRI analysis which iteratively tests voxel-by-voxel differences, MVPA unbiasedly detects differences in the spatial pattern of activity signals across multiple neighboring voxels using a machine-learning algorithm, improving the sensitivity of detecting significantly activated brain regions while incorporating covariates in spatially adjacent regions [19, 20]. By implementing the machine learning-assisted classification of the axonal plasticity pattern between control and stroke conditions, MPPA facilitated sensitive comparison of the quantitative differences and enabled fine spatial mapping of the post-stroke axonal reorganization even in the regions with dense axonal projections.
MATERIALS AND METHODS
Animals
All animal experiments were performed under the permission of the Institutional Animal Care and Use Committee of Ajou University Medical Center. Eight to ten weeks old C57BL6/J mice were used to generate a photothrombotic ischemic stroke mouse model. Mice were anesthetized with ketamine (90 mg/kg) and xylazine (10 mg/kg). Mice were fixed on a stereotaxic frame connected to a fiber-optic light source (12-562-36, Fisher-Scientifics, Massachusetts, U.S.). Animals were maintained on a 37.0oC heating pad during the procedure. Approximately 2 cm of incision was made along the midline of the head to expose the skull. The center of the fiber-optic was placed on the skull to generate an ischemic stroke at the right caudal forelimb area (CFA, AP: 0.0 mm; ML: -1.8 mm). A photosensitive dye Rose Bengal (10 μg/ml, 100 ml/kg of body weight) was delivered intraperitoneally. After 5 min, cold light was illuminated through a 1.5 mm diaphragm for 25 min. After the incision wound was sutured, animals were transferred to a 37.0oC warming cage until they recovered from the anesthesia.
Anterograde axonal tracing
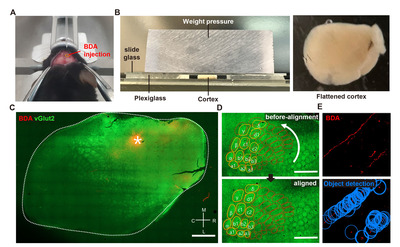
Biotinylated dextran amine (BDA, D1956, Thermo Fisher Scientific) was injected into the ipsilateral side of the infarcted cortex to trace axonal sprouting from the rostral forelimb area (RFA) following ischemic stroke. It has been reported that the RFA is a frequent region where functional reorganization occurs after a stroke in the CFA [21-23]. Functional reorganization after CFA stroke gradually occurred in RFA up to 4 weeks [24]. Therefore, BDA injection was performed at 4 weeks after the stroke induction. After animals were placed on a stereotaxic frame, a 1 mm-diameter burr hole was made on the skull using a hand drill (Fig. 2A). After loading one μl of 10% BDA to a pulled-capillary glass on a Hamilton syringe, BDA was delivered into the cerebral cortex at the predetermined coordinate of the RFA (AP: +1.5 mm; ML: -1.8 mm; DV: -1.0 mm) using an infusion pump (KD Scientific, KDS310) at a rate of 0.4 μl/min. The capillary glass needle was removed 2 min after the infusion was completed. The incision wound was sutured and sterilized.
Tissue preparation and histochemical processes
Animals were sacrificed one week after the BDA injection. Mice were transcardially perfused with cold PBS and 4% paraformaldehyde, and the whole brain was removed from the skull. The BDA-injected cortical hemisphere was tangentially dissected following previous reports with a slight modification [25, 26]. Briefly, dissected cortical tissue was placed between the two tiers of slide glasses with two mm-thick plexiglasses set on either side (Fig. 2B). To flatten the tissue, the upper glass slide was slightly pressured with another plexiglass weighing approximately 35.0 g put on top of it (Fig. 2B). PBS was added to the squeezed cortical tissue to prevent it from being drying out. The tissue was kept at 4oC for 4 h with constant pressure on the slide glasses. After 4 h, the flattened cortex was postfixed in 4% paraformaldehyde at 4oC for 16 h. The tissue was immersed in 30% sucrose at 4oC until the tissue sank to the bottom. The flattened cerebral hemisphere was sliced into 50 μm-thick sections using a microtome (MICROM GmbH, HM440E), and collected cortical sections were stored in a cryoprotectant buffer (30% glycerol, 30% ethylene glycol, 0.5M phosphate buffer) until use. Five to six tangential sections were typically collected from one flattened cortical tissue. To visualize the BDA-traced axons, tissue sections were washed with PBS for 5 min and blocked with a blocking solution (10% normal goat serum, 0.3% triton X-100) at room temperature for 30 min. Then, endogenous biotin was blocked using Avidin/Biotin blocking kit (#SP-2001, Vector lab) following the manufacturer’s instructions. Sections were incubated with the Streptavidin-Alexa 594 (Invitrogen, 1:500) at 4oC for 48 h. Alexa 488 conjugated secondary antibody (Invitrogen, 1:500) was treated at room temperature for 2 h. To visualize the barrel cortex of which the spatial information was required for the alignment of images from different animals, we used anti-vGLUT-2 (Synaptic Systems, 1:500) antibodies known to visualize the barrel cortex [27]. Classically, the barrel cortex has been visualized by cytochrome oxidase (COX) staining [28]. However, COX staining of tissue fixed with a high concentration of fixative causes decreased COX staining intensity, making it difficult to visualize with a conventional fixation method [29]. Moreover, COX staining takes an additional step after BDA visualization. Therefore, we simplified the staining protocol by simultaneously incubating the Streptavidin-Alexa 594 for BDA and vGlut2 antibody for the barrel cortex.
Imaging processing
All collected tissue sections were imaged using a confocal microscope (LSM800; Zeiss, Germany) with the tile-scanning function of Zeiss’s Zen Blue software to cover the entire 2D area of the tissue. All the obtained images were aligned based on the location of the barrel cortex visualized by vGlut2 immunoreactivity (Fig. 2C). The barrel cortex was observed from 3 to 4 consecutive cortical tissue section images. Of these images with distinctive vGlut2 signals, a single image with the brightest BDA injection signal was chosen for further image processing. For the alignment, the barrel cortex was manually contoured, and each section image was rotated up to 8 degrees to fit the barrel cortex into the contour (Fig. 2D). Acquired images in TIF format were imported into Stereo Investigator software (MBF Bioscience, USA). The BDA-traced axons were automatically identified and digitally marked using the “Mark Detected Objects” function embedded in the software (Fig. 2E). The threshold for the object detection function was set to 90.2%. The BDA-marked data file was then exported to Neurolucida Explorer software (MBF Bioscience, USA) and converted into the Cartesian coordinates. The Cartesian coordinates of all the images were aligned based on the coordinates of the injection site (ML: 1.8, AP: 1.5), which was determined as the center of the area with the saturated BDA signal.
Multi-pixel pattern analysis using MATLAB
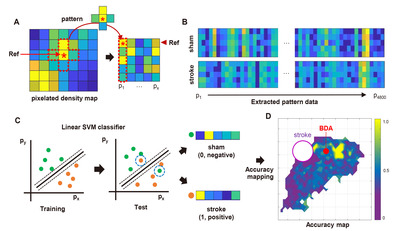
The Cartesian coordinates of the BDA digital marks were imported to MATLAB software to generate the pixelated axonal density map (Fig. 3A). The “Linspace” function in MATLAB software was used to create a matrix (4 mm × 4 mm) composed unit pixels encompassing all the BDA positive digital marks. Each pixel size was determined as 0.01 mm2 with a total square matrix of 1600 pixels. We used the “Histcount2” function to measure the number of the BDA digital marks of which the Cartesian coordinates fell into each pixel, and the density of BDA digital marks was expressed as a color-coded map. Within each group, the pixel data for all subjects were averaged. To extract the pattern (quantitative and spatial) of the BDA digital marks in different experimental conditions, 4,800 pixels were randomly selected as reference pixels using the “Randi” function. Then, a cross-shaped of five pixels, consisting of the reference pixel at the center and the four neighboring pixels surrounding the reference, was used as a unit source data for analyzing the pattern (Fig. 3A). It was worth noting that the background noise or isolated tiny BDA signals detected during the digitization process could generate noise pixels with negligible signals. To minimize the background noise, an extraction trial was discarded if no BDA digital mark was counted in more than four of the five selected pixels in each set. The location of randomly selected pixels within the matrix was earmarked to match the pattern data with the individual reference pixel. Each extracted pattern data was labeled as a sham or stroke group. To classify individual pattern data, a support vector machine (SVM) classifier embedded in “Statistics and Machine Learning Toolbox 12.3” was trained using the labeled extracted pattern data (Fig. 3C). The SVM is a machine learning classifier that can be used for binary classification. It finds the best separating decision boundary (hyperplane) with maximum margin for accurate classification. Then, all the data sets were classified without group labeling by the trained SVM classifier with 10-fold cross-validation. A pattern data set from the stroke group (actual) was logically classified as “Positive,” and a set from the sham group (actual) was as “Negative.” If a prediction by the classifier was consistent with a real classification, the corresponding classification trial was recorded as “True”; if a prediction was not consistent with a real one, the corresponding trial was registered as “False.” For example, if the classifier predicted a pattern set obtained from the stroke group as “stroke,” the trial was recorded as “True Positive.” If the classifier predicted a pattern set obtained from the sham group as “sham,” the trial was registered as “True Negative.” The accuracy of each classification trial was defined below,
Accuracy=(TP+TN)/(TP+FP+TN+FN)
*TP: true positive, FP: false positive, TN: true negative, FN: false negative
The classifier accuracies of individual pixels were plotted as a color-coded value onto the pixelated Cartesian coordinates to generate an accuracy map (Fig. 3D). Statistical significance of classification accuracy was tested using a binomial distribution. Individual pixel’s p value was calculated as a probability of correct classification when the chance of correct classification was 50%. Classification accuracy and p value map were plotted on the matrix after Benjamini-Hochberg multiple comparison correction. A three-dimensional mouse brain template was obtained from the online open source 'BrainMesh: A Matlab GUI for rendering 3D mouse brain structures (https://github.com/Yaoyao-Hao/BrainMesh/)’, and the accuracy and the p value maps were also overlaid on the 3D brain template. Finally, a student’s t-test was performed to determine a between-group significance based on machine learning classification. The number of BDA densities on the pixels that FDR is below 0.05 were compared using a two-tailed t-test.
RESULTS
The purpose of the method we developed was to quantitatively compare the amount and spatial distribution of BDA-traced intracortical axons between different experimental groups. The entire workflow of this method consists of several separate but sequential processes beginning from the BDA injection and visualization to the machine learning classification leading to the accuracy mapping and statistical analysis (Fig. 1).
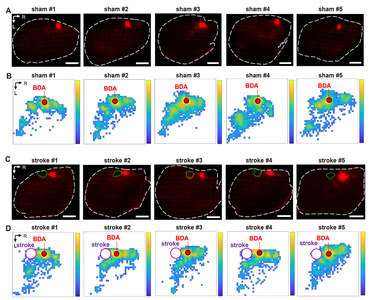
The processes from the BDA injection to the derivation of the Cartesian coordinates from the digitized BDA-positive axon signals are illustrated in Fig. 2. We first sought to establish methods to trace intracortical axons tangentially running in parallel with the cortical lamination. Following a standard intracortical BDA injection into the rostral forelimb area (RFA) (Fig. 2A), cortical tissue was tangentially dissected from the hemisphere and flattened using a device modified from the previously reported setup used to visualize cortical modules (Fig. 2B) [25]. To minimize inter-subject variability of the visualized intracortical axons, it was critical to ensure the consistent thickness of the flattened cortex using this device. The weight (35 g) of the plexiglass utilized to put pressure on the glass slides was optimized to prevent over-flattening or unpredicted tissue tears. Using this method, we obtained 2D images of the BDA-traced intracortical axons, of which signal intensities were highly comparable among those from all the animals in both groups (Fig. 4A, C).
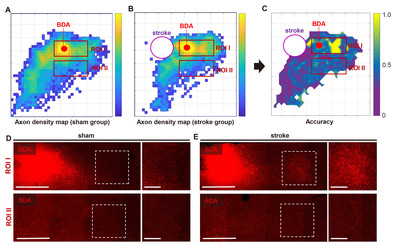
The BDA positive histochemical signals were processed in three steps to generate a digitized axonal density map (Fig. 4B, D) from which the machine learning classification is performed. First, the BDA fluorescence signals were automatically transformed into the digitized marks using Stereo Investigator software (Fig. 2E). Then, the digital marks were converted into the Cartesian coordinates using Neurolucida Explorer software. Finally, a color-coded map representing the pixel-based axon density was created from the Cartesian coordinates using MATLAB functions (Fig. 4). Although the pixelated axon density maps in each group revealed a within-group inter-subject variation, there was a distinctive pattern of changes in axon density distribution in stroke animals, which was visualized in the maps of the group-average axon density (Fig. 5A, B). In sham-operated animals, BDA-labeled axons were densely populated in the caudolateral direction from the injection site, suggesting tight axonal interactions between rostral and caudal motor regions. The stroke increased the axon density in the area more rostral to the injection site. In addition, there was also a robust increase in the axon density in the peri-infarct regions caudomedial to the injection site.
Based on the pixelated axon density maps, we performed the MPPA analysis for sensitive detection of the differences in the amount and spatial distribution of BDA signals in an unbiased manner. A machine learning algorithm (SVM) was utilized to train the classifier to differentiate the patterns of axon density distribution in a reference pixel and four neighboring pixels surrounding the reference one (Fig. 3A). Then, the same pattern datasets were tested using the trained classifier whether the sham or stroke pattern can be accurately predicted (Fig. 3C). The classifier accuracy was calculated in each reference pixel and mapped to the Cartesian matrix pixels (Fig. 5C). The classifier accuracy in each pixel was supposed to represent a quantitative indicator of the difference between sham and stroke groups in the axon density distribution incorporating the covaried density in the neighboring pixels. In the classifier accuracy map, the accuracy level was noticeably higher in the regions rostral to the BDA injection, where the digitally marked signals were increased in the pixelated axon density map in the stroke group (Fig. 5B). We correlated the actual BDA-traced fluorescence signals with the classifier accuracy map. A representative actual BDA-traced image also showed an apparent increase in the axon density in the stroke group in the regions where the accuracy level was high (Fig. 5D). In contrast, the accuracy level was very low at the peripheral areas far from the injection site. In these regions, the axonal density was very low either in the sham or stroke group (Fig. 5E). Although there were differences in the distribution pattern of the sparse axons based on the pixelated axon density map (Fig. 5A, B), low signal density seemed to reduce the classifier accuracy in these regions.
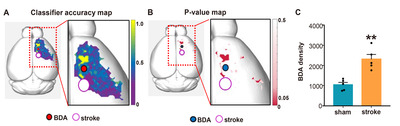
To facilitate localizing cortical regions in mouse brains, the pixel-based accuracy data were mapped again onto the 3D brain template (Fig. 6A). The final color-coded accuracy map visualized the spatial distribution of the cortical regions where the axon density pattern was different enough to be accurately classified by a machine learning algorithm. To determine the statistical significance of the accuracy value in differentiating between sham and stroke groups, we also created the p value map in which pixels where the binominal distribution test resulted in a p value less than 0.05 (Fig. 6B). When the axon signal intensities in each group were combined from the pixels with statistically significant accuracy value, the axon density was significantly higher in stroke group than that in the sham group (Fig. 6C), suggesting that axonal sprouting is elicited robustly in specific cortical regions following stroke.
DISCUSSION
BDA axonal tracing is one of the standard techniques that examine the extent of axonal sprouting that occurs following CNS injuries such as stroke and trauma. However, there are difficulties in the quantitative evaluation of BDA axons in histological tissue sections, particularly in the cerebral cortex with a vast number of BDA-traced axons. Even subtle differences in the extent of axonal sprouting could be meaningful depending on the anatomical localization. However, those differences are often difficult to be quantitatively detected in an unbiased manner using conventional analytical methods. To develop an imaging analysis tool that can be used for histological images of the intracortical axons, the current study established MPPI, a machine learning-assisted workflow based on the benefits of MVPA (Fig. 1). MVPA is a machine learning-based imaging analysis technique which is widely used in the neuroimaging field such as fMRI imaging [19]. Instead of the fMRI paramagnetic activation signals, this study analyzed digitized histological signal intensities by slightly modifying the processes developed for MVPA. Axonal tracing of BDA in tangentially sectioned tissue allowed observation of axonal projections in anatomically similar layers of the cortex. Pixelation of the Cartesian coordinates generated spatial pattern information representing the pixel-based density of BDA signals across neighboring regions. The machine learning classifier SVM classified the patterns depending on the trained pattern from each group, calculating the classification accuracy in individual pixels representing a degree of differences between the sham and stroke groups in the pattern of axonal density distribution. These processes facilitated the creation of the classifier accuracy-based statistical map, which indicates the spatial specificity of intracortical axonal sprouting in ischemic stroke animals.
Machine learning-based pattern analysis can detect between-group differences in blood oxygenation level dependent (BOLD) signals of fMRI images with high sensitivity and specificity [30]. This approach has been frequently complemented with a searchlight method, in which activation signals are extracted from several neighboring voxels with every reference voxel [31]. This combination allows multivariate statistical comparison as opposed to univariate statistics in conventional fMRI analysis, further enhancing the sensitivity of group difference detection. In our study, BDA-traced axon signals were converted to Cartesian coordinates, which were then used to build the pixelated BDA density map. The BDA density distribution in this map could be used to extract the pattern information. Therefore, we speculated that the machine learning-assisted pattern analysis paradigm combined with the searchlight method developed for the fMRI analysis could be applied to analyzing histological data to uncover quantitative and spatial differences between groups. To test this idea, an SVM algorithm with the searchlight method was built, as depicted in Fig. 3. In this algorithm, a pattern dataset consisted of the information from the reference pixel and that from the neighboring 4 pixels surrounding the reference, taking a cross-like shape (Fig. 3A). Iterative randomized selection of the patterns using the searchlight method generated specific pattern datasets from each group (Fig. 3B). It is highly likely that incorporating the signal information from the surrounding cortical regions in the pattern datasets implement the context of the multivariate comparison during the classifier testing and contribute to the precise localization of the cortical areas where axonal plasticity occurrs following stroke.
One of the characteristics of our machine learning classifier was to predict relatively small cortical regions with high classification accuracy, compared to seemingly highly different signal distributions between the two group-average pixelated axon density maps over broad areas (Fig. 5A~C). Indeed, the density of axon signals at the periphery of the map was low, and the SVM algorithm seemed unable to classify either group with high accuracy in these regions with a low axon density. It is conceivable that a pattern dataset consisting of pixels all with a low density would have lower saliency than those with a variable density ranging from low to high. The pattern with low saliency is likely to result in low classification accuracy. Therefore, we interpret that our machine learning algorithm tends to classify “positive” and “negative” more accurately in cortical regions with a high axon density than those with a low density. The propensity of accurate classification in cortical areas with dense axonal projections in our paradigm contrasts a previous study in which the differences in axonal sprouting were found at the periphery of the BDA map where the axon density is supposedly low [32]. In actual histological samples, we observed that the cortical regions with high classifier accuracy contained a large amount of axons in both sham and stroke groups. Still, the difference in axon density was appreciable enough to be classified into a separate group (Fig. 5D). In comparison, a small number of axons were observed in peripheral regions with low classifier accuracy. Although the distribution of these spares axons was spatially different between the two groups, the absolute low level of axon density would indicate that the difference might not have significant biological meanings.
It has been well documented that the cortical motor map undergoes a large scale of reorganization following stroke [24, 33-35]. For example, upon ischemic injury to the CFA in rats, functional recovery was closely related to changes in connectivity between the sensory and premotor cortex connected to the RFA [34]. These results suggest that intracortical axonal sprouting or plasticity may underlie the reorganization of the cortical motor map and functional recovery. In the present study, we delivered BDA into the RFA following ischemic stroke over the CFA to evaluate axonal plasticity. Our result of increased axonal sprouting to the rostral regions suggests that axonal connection from the RFA to the premotor cortex is strengthened following stroke. This finding may indicate the reorganization of the premotor cortex to compensate for the destruction of CFA-derived motor circuits. In fact, functional reorganization of the premotor cortex was documented in a human stroke study [35]. We also observed a robust increase in the axon density in the peri-infarct regions caudomedial to the RFA injection site. A previous study showed that a stroke lesion created in the CFA led to a robust recovery of functional maps in the RFA [24]. Therefore, the substantial increase of the axonal sprouting from the RFA to the CFA stroke lesion may reflect the intracortical motor circuit remodeling to substitute the lost CFA motor representations. These findings support that the method we developed in this study can successfully discover intracortical axonal plasticity that may mediate functional reorganization of the motor circuit following stroke. This method also has the potential to be applied in broader fields of neuroscience research involving not only axonal plasticity but also axonal degeneration or developmental defects in axonal projections. For example, amyloid deposition in an Alzheimer’s disease animal model disrupts entorhinal axon projections to the dentate gyrus [36]. Our method could be utilized to quantitatively analyze the pattern of disrupted axonal projection with compensatory plastic changes during the pathological progression.
ACKNOWLEDGEMENTS
This research was supported by NRF research programs (2021R1A2C2006110, 2021M3E5D9021364, 2019R1A5A2026045 to BGK), and NRF Global Ph.D. Fellowship Program (2018H1 A2A1061966 to HSK).
Figures
References
- Kwakkel G, Kollen BJ, van der Grond J, Prevo AJ (2003) Probability of regaining dexterity in the flaccid upper limb: impact of severity of paresis and time since onset in acute stroke. Stroke 34:2181-2186


- Rasmussen R, Carlsen EM (2016) Spontaneous functional recovery from incomplete spinal cord injury. J Neurosci 36:8535-8537

- McCrea MA, Giacino JT, Barber J, Temkin NR, Nelson LD, Levin HS, Dikmen S, Stein M, Bodien YG, Boase K, Taylor SR, Vassar M, Mukherjee P, Robertson C, Diaz-Arrastia R, Okonkwo DO, Markowitz AJ, Manley GT, Adeoye O, Badjatia N, Bullock MR, Chesnut R, Corrigan JD, Crawford K, Duhaime AC, Ellenbogen R, Feeser VR, Ferguson AR, Foreman B, Gardner R, Gaudette E, Goldman D, Gonzalez L, Gopinath S, Gullapalli R, Hemphill JC, Hotz G, Jain S, Keene CD, Korley FK, Kramer J, Kreitzer N, Lindsell C, Machamer J, Madden C, Martin A, McAllister T, Merchant R, Ngwenya LB, Noel F, Nolan A, Palacios E, Perl D, Puccio A, Rabinowitz M, Rosand J, Sander A, Satris G, Schnyer D, Seabury S, Sherer M, Toga A, Valadka A, Wang K, Yue JK, Yuh E, Zafonte R; TRACK-TBI Investigators (2021) Functional outcomes over the first year after moderate to severe traumatic brain injury in the prospective, longitudinal TRACK-TBI study. JAMA Neurol 78:982-992
- Kirshblum S, Snider B, Eren F, Guest J (2021) Characterizing natural recovery after traumatic spinal cord injury. J Neurotrauma 38:1267-1284
- Nakayama H, Jørgensen HS, Raaschou HO, Olsen TS (1994) Recovery of upper extremity function in stroke patients: the Copenhagen stroke study. Arch Phys Med Rehabil 75:394-398
- Cassidy JM, Cramer SC (2017) Spontaneous and therapeutic-induced mechanisms of functional recovery after stroke. Transl Stroke Res 8:33-46
- Overman JJ, Carmichael ST (2014) Plasticity in the injured brain: more than molecules matter. Neuroscientist 20:15-28
- Cramer SC (2008) Repairing the human brain after stroke: I. Mechanisms of spontaneous recovery. Ann Neurol 63:272-287
- Nudo RJ, Plautz EJ, Frost SB (2001) Role of adaptive plasticity in recovery of function after damage to motor cortex. Muscle Nerve 24:1000-1019
- Murphy TH, Corbett D (2009) Plasticity during stroke recovery: from synapse to behaviour. Nat Rev Neurosci 10:861-872
- Hess G, Donoghue JP (1994) Long-term potentiation of horizontal connections provides a mechanism to reorganize cortical motor maps. J Neurophysiol 71:2543-2547
- Darian-Smith C, Gilbert CD (1994) Axonal sprouting accompanies functional reorganization in adult cat striate cortex. Nature 368:737-740
- Florence SL, Taub HB, Kaas JH (1998) Large-scale sprouting of cortical connections after peripheral injury in adult macaque monkeys. Science 282:1117-1121
- Carmichael ST, Kathirvelu B, Schweppe CA, Nie EH (2017) Molecular, cellular and functional events in axonal sprouting after stroke. Exp Neurol 287(Pt 3):384-394
- Li S, Overman JJ, Katsman D, Kozlov SV, Donnelly CJ, Twiss JL, Giger RJ, Coppola G, Geschwind DH, Carmichael ST (2010) An age-related sprouting transcriptome provides molecular control of axonal sprouting after stroke. Nat Neurosci 13:1496-1504
- Kugler C, Thielscher C, Tambe BA, Schwarz MK, Halle A, Bradke F, Petzold GC (2020) Epothilones improve axonal growth and motor outcomes after stroke in the adult mammalian CNS. Cell Rep Med 1:100159
- Chen P, Goldberg DE, Kolb B, Lanser M, Benowitz LI (2002) Inosine induces axonal rewiring and improves behavioral outcome after stroke. Proc Natl Acad Sci U S A 99:9031-9036
- Joy MT, Ben Assayag E, Shabashov-Stone D, Liraz-Zaltsman S, Mazzitelli J, Arenas M, Abduljawad N, Kliper E, Korczyn AD, Thareja NS, Kesner EL, Zhou M, Huang S, Silva TK, Katz N, Bornstein NM, Silva AJ, Shohami E, Carmichael ST (2019) CCR5 is a therapeutic target for recovery after stroke and traumatic brain injury. Cell 176:1143-1157.e13
- Norman KA, Polyn SM, Detre GJ, Haxby JV (2006) Beyond mind-reading: multi-voxel pattern analysis of fMRI data. Trends Cogn Sci 10:424-430
- Davatzikos C, Ruparel K, Fan Y, Shen DG, Acharyya M, Loughead JW, Gur RC, Langleben DD (2005) Classifying spatial patterns of brain activity with machine learning methods: application to lie detection. Neuroimage 28:663-668
- Conner JM, Chiba AA, Tuszynski MH (2005) The basal forebrain cholinergic system is essential for cortical plasticity and functional recovery following brain injury. Neuron 46:173-179
- Nishibe M, Urban ET 3rd, Barbay S, Nudo RJ (2015) Rehabilitative training promotes rapid motor recovery but delayed motor map reorganization in a rat cortical ischemic infarct model. Neurorehabil Neural Repair 29:472-482
- Gao H, Sun M, Li M, Wang C, Yu C, Wang Y, Xu K (2021) Force decoding of caudal forelimb area and rostral forelimb area in chronic stroke rats. IEEE Trans Biomed Eng 68:3078-3086
- Okabe N, Shiromoto T, Himi N, Lu F, Maruyama-Nakamura E, Narita K, Iwachidou N, Yagita Y, Miyamoto O (2016) Neural network remodeling underlying motor map reorganization induced by rehabilitative training after ischemic stroke. Neuroscience 339:338-362
- Lauer SM, Schneeweiß U, Brecht M, Ray S (2018) Visualization of cortical modules in flattened mammalian cortices. J Vis Exp 131:56992
- Blits B, Boer GJ, Verhaagen J (2002) Pharmacological, cell, and gene therapy strategies to promote spinal cord regeneration. Cell Transplant 11:593-613
- Liguz-Lecznar M, Skangiel-Kramska J (2007) Vesicular glutamate transporters VGLUT1 and VGLUT2 in the developing mouse barrel cortex. Int J Dev Neurosci 25:107-114
- Wong-Riley M (1979) Changes in the visual system of monocularly sutured or enucleated cats demonstrable with cytochrome oxidase histochemistry. Brain Res 171:11-28
- Liu Y, Gu Q, Cynader MS (1993) An improved staining technique for cytochrome C oxidase. J Neurosci Methods 49:181-184
- Misaki M, Kim Y, Bandettini PA, Kriegeskorte N (2010) Comparison of multivariate classifiers and response normalizations for pattern-information fMRI. Neuroimage 53:103-118
- Kriegeskorte N, Goebel R, Bandettini P (2006) Information-based functional brain mapping. Proc Natl Acad Sci U S A 103:3863-3868
- Overman JJ, Clarkson AN, Wanner IB, Overman WT, Eckstein I, Maguire JL, Dinov ID, Toga AW, Carmichael ST (2012) A role for ephrin-A5 in axonal sprouting, recovery, and activity-dependent plasticity after stroke. Proc Natl Acad Sci U S A 109:E2230-E2239
- Jeffers MS, Touvykine B, Ripley A, Lahey G, Carter A, Dancause N, Corbett D (2020) Poststroke impairment and recovery are predicted by task-specific regionalization of injury. J Neurosci 40:6082-6097
- Hayley P, Tuchek C, Dalla S, Borrell J, Murphy MD, Nudo RJ, Guggenmos DJ (2023) Post-ischemic reorganization of sensory responses in cerebral cortex. bioRxiv. doi: 10.1101/2023.01.18.524583
- Johansen-Berg H, Rushworth MF, Bogdanovic MD, Kischka U, Wimalaratna S, Matthews PM (2002) The role of ipsilateral premotor cortex in hand movement after stroke. Proc Natl Acad Sci U S A 99:14518-14523
- Pooler AM, Polydoro M, Wegmann SK, Pitstick R, Kay KR, Sanchez L, Carlson GA, Gomez-Isla T, Albers MW, Spires-Jones TL, Hyman BT (2013) Tau-amyloid interactions in the rTgTauEC model of early Alzheimer's disease suggest amyloid-induced disruption of axonal projections and exacerbated axonal pathology. J Comp Neurol 521:4236-4248